
Trading position (short-term; our opinion): Speculative short positions in crude oil seem to be justified from the risk/reward perspective.
On Wednesday, crude oil gained 0.99% as the EIA report showed an unexpected drop in crude-oil supplies. Thanks to this bullish news, after two failed attempts, light crude came back above the key level of $100 and invalidated the breakdown below one of the resistance lines. Are there any other encouraging signs on the horizon?
Yesterday, the U.S. Energy Information Administration showed in its weekly report that U.S. crude oil inventories declined unexpectedly by 1.8 million barrels in the week ended May 2, defying expectations for an increase of 1.4 million barrels. Additionally, earlier in the day, Federal Reserve Chairwoman Janet Yellen expressed positively about the U.S. recovery, indicating that the U.S. economy will rebound in the second quarter as the effects of the harsh winter on growth wane. Her commentary also suggested that the central bank will continue reducing its monthly bond purchases, paving the way for interest-rate increases next year. In reaction to this bullish news, crude oil surged to a one-week high and closed the day above the psychological barrier of $100 for the first time since Apr.29.
As we mentioned earlier, crude oil came back above two previously-broken resistance levels. Where are the next ones? Let’s check (charts courtesy of http://stockcharts.com).
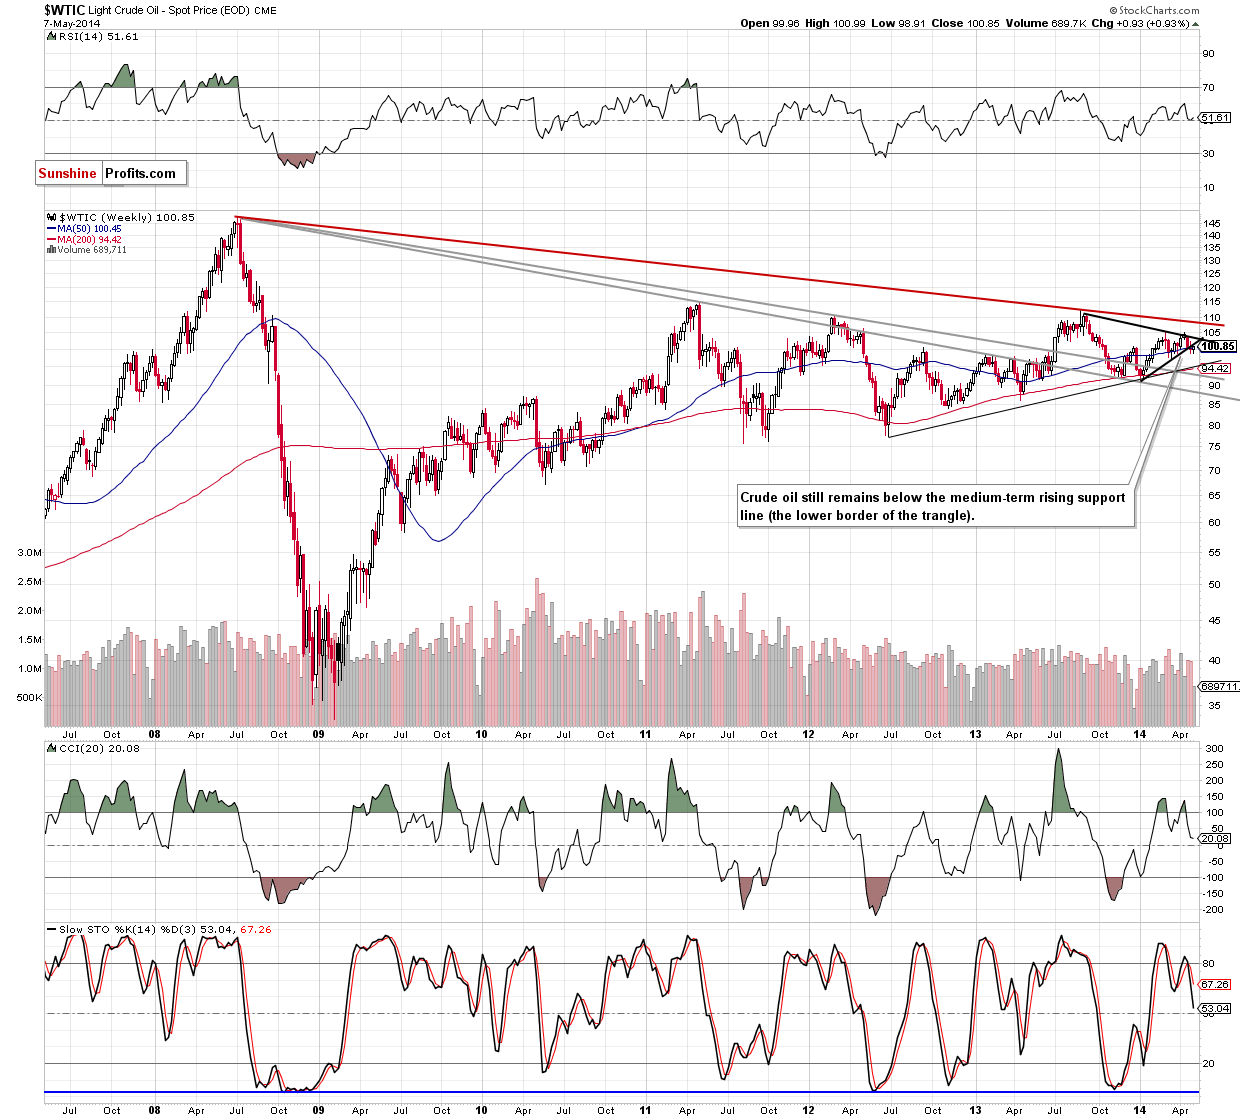
From the weekly perspective, we see that despite yesterday’s really, the situation hasn’t changed much as crude oil is still trading below the lower border of the triangle. Therefore, the bearish scenario from our Oil Trading Alert posted on Apr. 30 is still up-to-date:
(…) if the commodity extends losses and drops below the psychological barrier of $100, we will likely see further deterioration and a drop even to around $95, where the medium-term support line (based on the June 2012 and January 2014 lows) is. At this point, it’s worth noting that the CCI and Stochastic Oscillator generated sell signals, which suggests that another attempt to move lower should not surprise us.
Did the situation in the short term change after yesterday’s session? Let’s zoom in on our picture and find out.
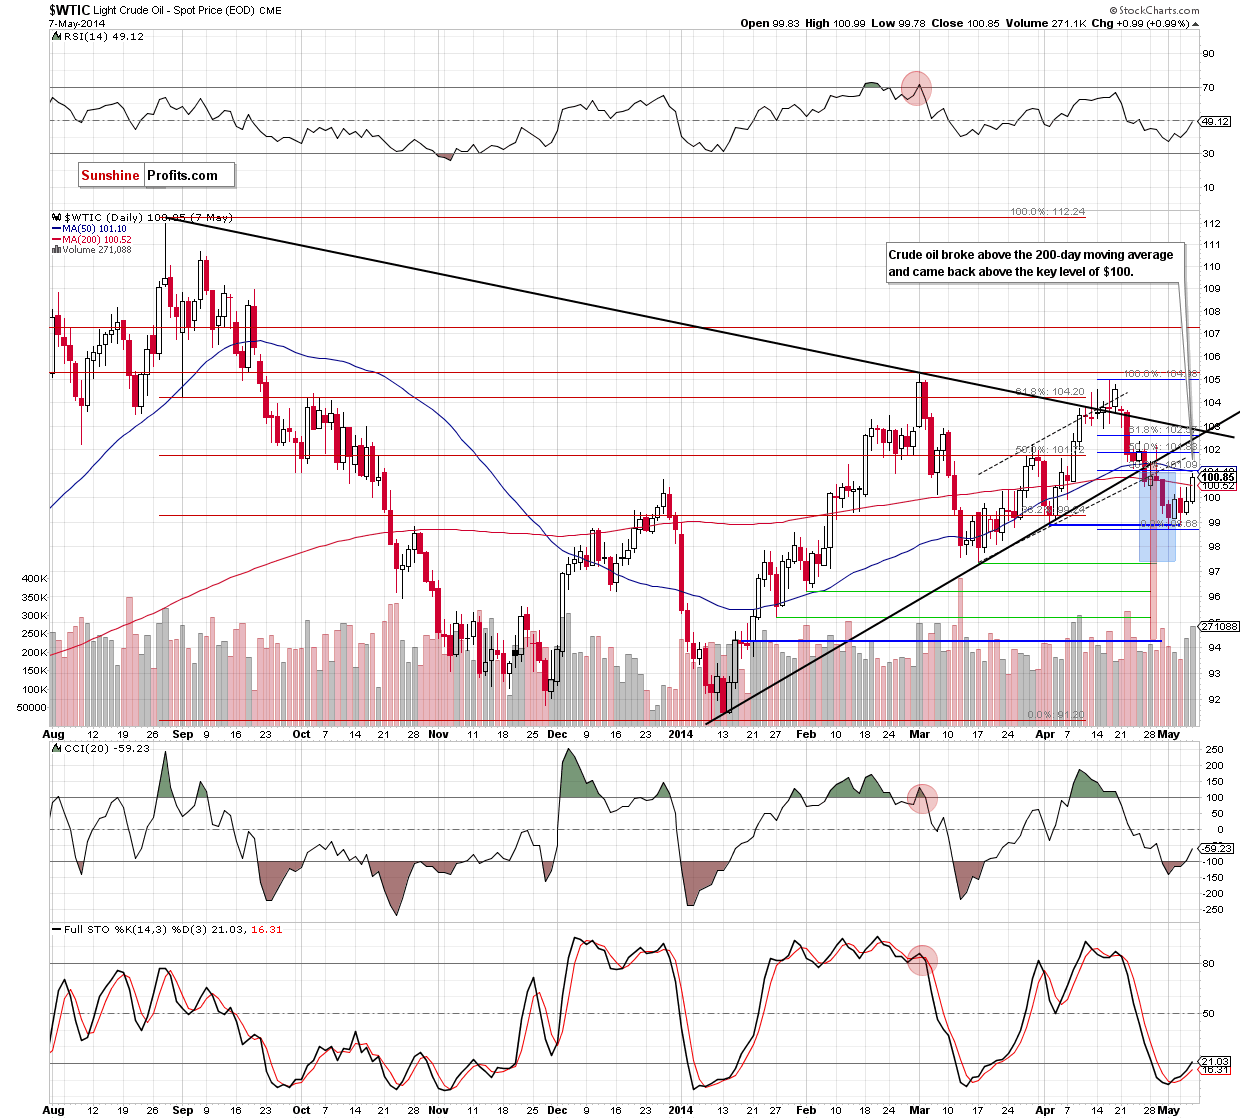
Looking at the daily chart, we see that crude oil rebounded and climbed above the psychological barrier of $100 and the 200-day moving average. The good news for oil bulls is that thanks to this move, the breakdown below these two resistance levels was invalidated. But did the very short-term situation turn bullish? Not really. The reason? The commodity not only still remains below two major resistance lines (the medium-term black line and the lower border of the rising trend channel), but also reached a resistance zone created by the 50-day moving average and the 38.2% Fibonacci retracement based on the entire recent declines.
This is the point where we should consider two scenarios. On one hand hand, if this area holds, we will see a pullback to the 200-day moving average and if it’s broken, the commodity could easily drop below $100 once again. On the other hand, if the resistance zone is broken, we may see an increase to the next Fibonacci retracement, which currently intersects the lower border of the rising trend channel. In our opinion, the latter is certainly the least likely of scenarios to play out, but cannot be ruled out as an option. However, even if we see such price action in the near future, the breakdown below the major resistance lines and its consequences still will be in play:
(…) In the case of the breakdown under the lower border of the trend channel, declines may push the price to around $97, where the size of the downswing will correspond to the height of the formation. Nevertheless, in our opinion, the confirmation of the breakdown below the medium-term line is more important because it suggests an even bigger move. In this case, the correction may be deeper and take light crude to around $94.20. At this point, it’s worth noting that the first downside target is supported by the March low of $97.37 and the latter corresponds to the 78.6% Fibonacci retracement based on the entire Jan.-March rally.
Summing up, the main development of yesterday’s session is an invalidation of the breakdown below the key level of $100 and also a comeback above the 200-day moving average. As we have pointed out before, despite this improvement, crude oil still remains below the medium-term black resistance line and the lower border of the rising trend channel. Therefore, we remain bearish and maintain our assumption that as long as there in no invalidation of the breakdown below these major resistance lines, further deterioration in the coming days (or even weeks) is likely.
Very short-term outlook: bearish
Short-term outlook: bearish
MT outlook: mixed
LT outlook: mixed
Trading position (short-term): Short. Stop-loss order: $102.50. We will keep you informed should anything change, or should we see a confirmation/invalidation of the above.
Thank you.
Nadia Simmons
Forex & Oil Trading Strategist
Przemyslaw Radomski, CFA
Founder, Editor-in-chief
Gold & Silver Trading Alerts
Forex Trading Alerts
Oil Investment Updates
Oil Trading Alerts

