
Trading position (short-term; our opinion): no positions are justified from the risk/reward perspective.
On Thursday, crude oil gained 2.26% as investors focused on escalating violence in Iraq, ignoring bearish U.S. data. As a result, light crude climbed to its highest level in nine months, hitting an intraday high of $106.95 and breaking above important resistance lines. How high can crude oil go in the near future?
On Wednesday, militants from the Islamic State in Iraq and Syria, seized the northern cities of Mosul and Tikrit. Yesterday, Iraqi insurgents linked to al-Qaeda reportedly took full control of the northern oil city of Kirkuk and advanced closer to the capital, Baghdad. The fact that the government continues to lose cities in a growing sectarian conflict renewed concerns over a disruption to supplies from the region and pushed the price of crude oil to its highest level since September.
Please note that Iraq has pumped out about 3.5 million barrels of oil a day this year. Much of that comes from the south, away from the conflict with sectarian militants, but there is increasing concern that the conflict could spread.
As we mentioned earlier, these geopolitical concerns overweighed bearish U.S. data.
Yesterday, the Commerce Department reported that U.S. retail sales rose 0.3% in May, missing expectations for a 0.6% gain. Core retail sales (without automobile sales) eased up 0.1% in May, disappointing forecasts for a 0.2% increase. Separately, the Labor Department reported that the number of individuals filing for initial jobless benefits in the week ending June 7 increased by 4,000 to 317,000, confounding expectations for a decline of 3,000.
How did these circumstances influence the technical picture? Let’s check (charts courtesy of http://stockcharts.com).
Quoting our previous Oil Trading Alert:
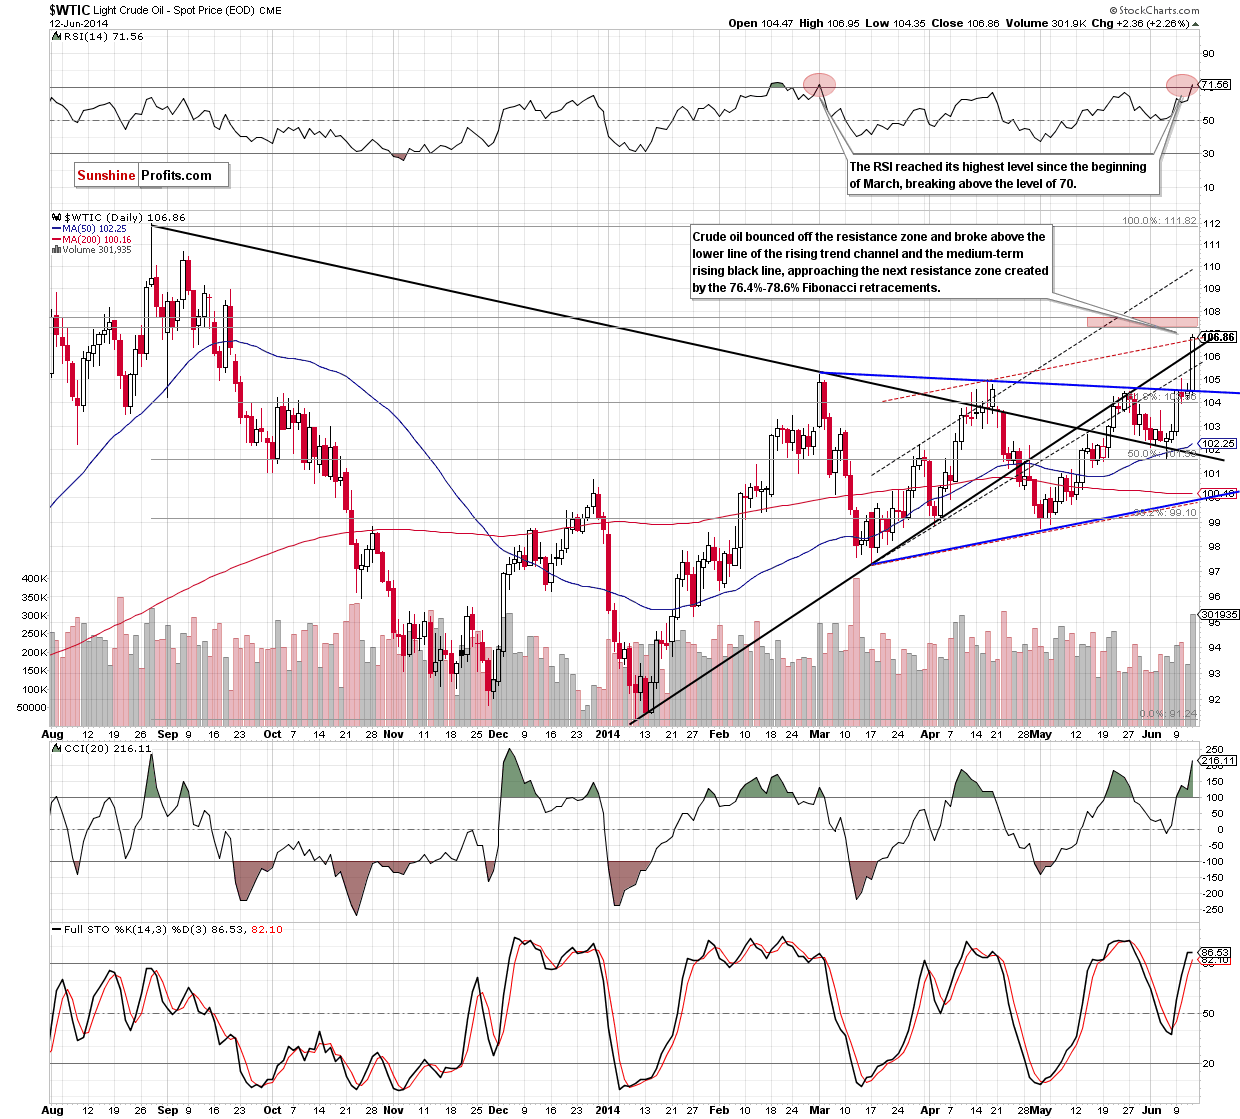
(…) as long as light crude remains around the blue declining resistance line another attempt to break above this key resistance line can’t be ruled out. If we see such price action, the next upside target will be the March high of $105.22 or even the lower border of the rising trend channel (currently around $105.50).
Looking at the above chart, we can summarize it in one simple sentence: third time lucky. As you see on the daily chart, crude oil broke above the blue declining resistance line, which triggered a sharp upswing that took the commodity not only to the above-mentioned levels, but also above the medium-term black rising resistance line. This is a strong bullish signal (especially when we take into account the size of the volume that accompanied yesterday’s move), which suggests further improvement. At this point, we would like to draw your attention to the fact that an upswing above the blue resistance line means the breakout above the upper line of the medium-term triangle. Therefore, if crude oil extends gains, we may see an increase even to around $112, where the size of the upward move will correspond to the height of the triangle. But will crude oil climb so high? From this perspective, it seems doubtful as the space for further growth might be limited in the near future. In our opinion, oil bulls could have a tough time breaking through the next resistance zone created by the 76.4% and 78.6% Fibonacci retracement levels (around $107.30-$107.75). The reason for such assumption is not only the fact that this is a strong resistance zone, which usually pauses (or even stops) further improvement, but also the conclusion which emerges from the long-term chart.
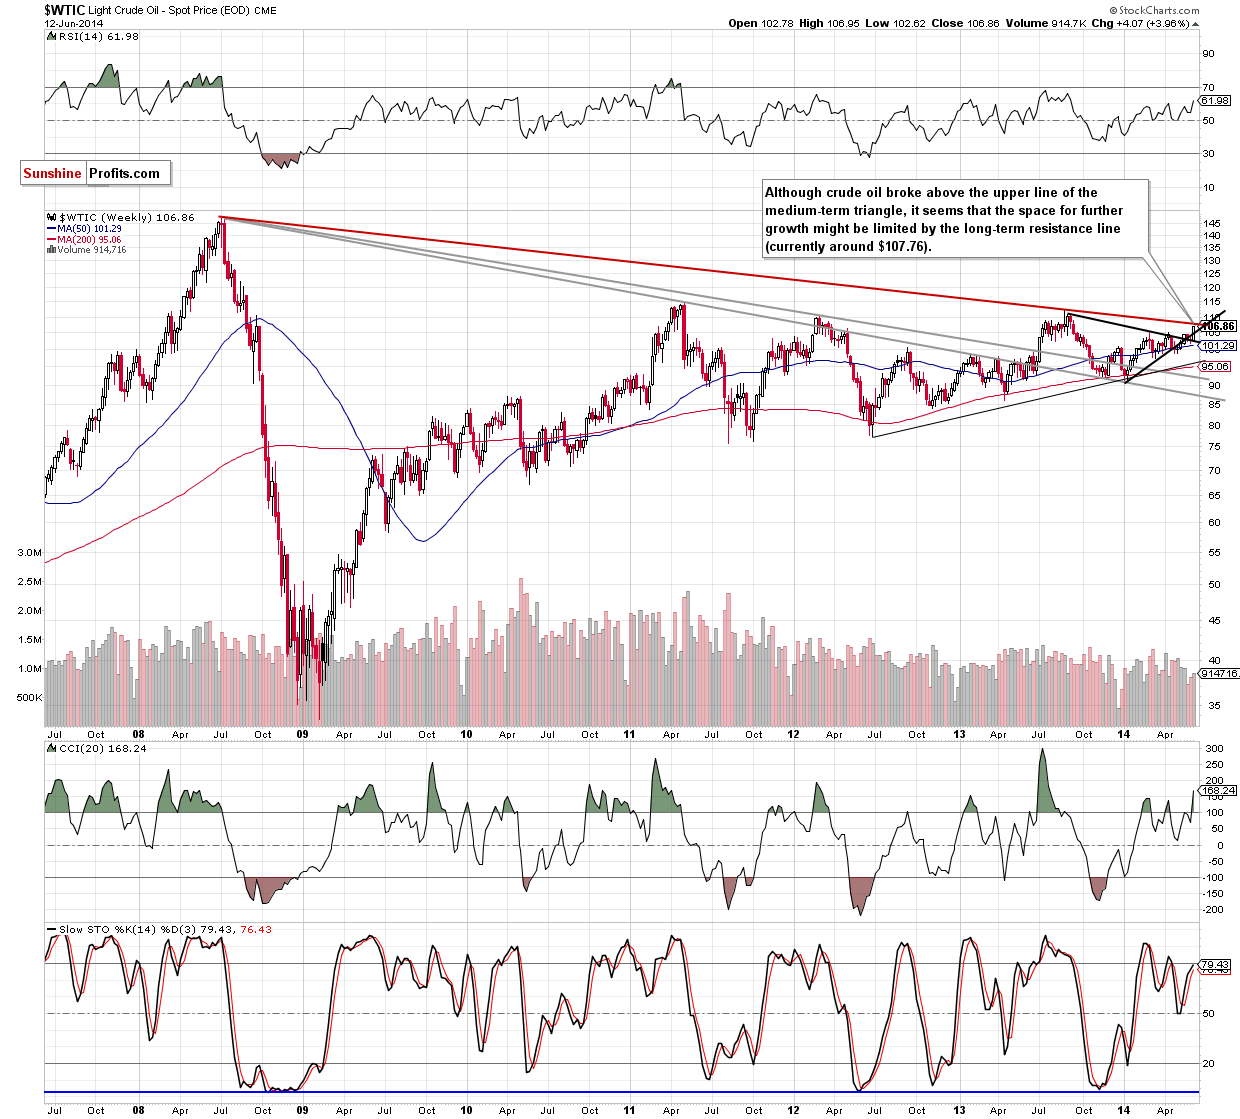
From this perspective, we noticed two major things: the breakout above the medium-term black line and the proximity to the long-term declining line. As you see on the above chart, this important line is currently around $107.76 and reinforces the resistance zone that we mentioned discussing the very short-term picture. Additionally, the CCI is overbought, while the Stochastic Oscillator approached the level of 80 (on top of that, the daily RSI reached its highest level since the beginning of March, breaking above the level of 70). Connecting the dots, it seems that as long as there is no breakout above this key price level, another sizable move is not likely to be seen.
Summing up, the medium-, short- and very short-term situation has improved significantly as crude oil rebounded sharply, breaking above the resistance zone (created by the March high and the lower border of the rising trend channel), the medium-term rising resistance line and the upper line of the medium-term triangle (which may trigger a sizable move even to around $112). As we have pointed out before, this is a strong bullish signal as the breakout materialized on large volume, confirming the strength of oil bulls. Despite these positive circumstances, we should keep in mind that not far from the current levels there is a strong resistance zone (created by the 76.4% and 78.6% Fibonacci retracement levels - around $107.30-$107.75 and reinforced by the long-term declining line), which may pause or even stop further improvement in the coming days.
Very short-term outlook: bullish
Short-term outlook: mixed
MT outlook: mixed
LT outlook: mixed
Trading position (short-term): In our opinion no positions are justified from the risk/reward perspective at the moment. We will keep you informed should anything change, or should we see a confirmation/invalidation of the above.
Thank you.
Nadia Simmons
Forex & Oil Trading Strategist
Przemyslaw Radomski, CFA
Founder, Editor-in-chief
Gold & Silver Trading Alerts
Forex Trading Alerts
Oil Investment Updates
Oil Trading Alerts

