
Trading position (short-term): Short. Stop-loss orders for crude oil and WTI Crude Oil (CFD): $102.95.
On Wednesday, crude oil rose after the EIA showed in its weekly report a much larger-than-expected drop in petroleum-product stockpiles. An additional bullish factor which pushed the price higher was an announcement that the Federal Reserve would further reduce its bond-buying program. Despite these positive circumstances, light crude finished the day 43 cents below Tuesday closing price.
Yesterday, the U.S. Energy Information Administration showed in its weekly report that U.S. crude oil inventories rose by 5.9 million barrels to 375.9 million barrels in the week ended March 14, while analysts had expected an increase of 2.6 million barrels (at this point, it’s worth noting that crude oil supplies are at their highest level since November). However, the build in crude oil stocks was more than offset by a larger-than-expected decline in petroleum-product supplies. According to the EIA, distillate stockpiles declined by 3.1 million barrels, compared to expectations for a withdrawal of 625,000 barrels. Please note that distillate stocks are at their lowest level since 2008. These better-than expected numbers had a positive impact on the price and pushed light higher. Additionally, crude oil rose above $99 a barrel later in the trading day, after the Fed announced it would further reduce its bond purchases by another $10 billion a month in April, to $55 billion.
Having discussed the above, let’s move on to the technical changes in the crude oil market (charts courtesy of http://stockcharts.com.)
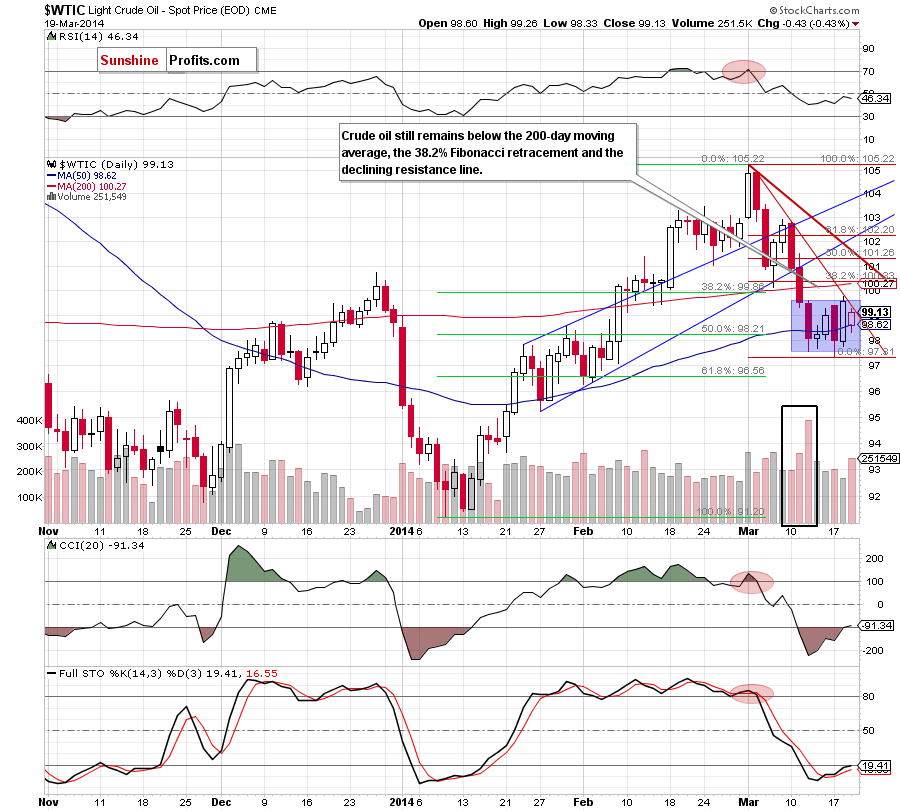
On the above chart, we see that the very short-term situation hasn’t changed much as crude oil still remains in a consolidation range. As you see on the daily chart, crude oil bounced off the 50-day moving average after the market open and climbed to the first declining resistance line (marked with red). Therefore, what we wrote in our last Oil Trading Alert is still up-to-date.
(…) If it encourages oil bears to act, we may see another attempt to move lower. If this is the case, the downside target will be the lower border of the consolidation range (around $97.55). However, if this line is broken, we may see further improvement and an increase to the 200-day moving average, which still serves as the major resistance (currently at $100.27). At this point it’s worth noting that this area is also reinforced by the 38.2% Fibonacci retracement based on the recent decline (around $100.33).
Before we focus on technical changes in the CFD, we would like to draw your attention to the weekly chart below.
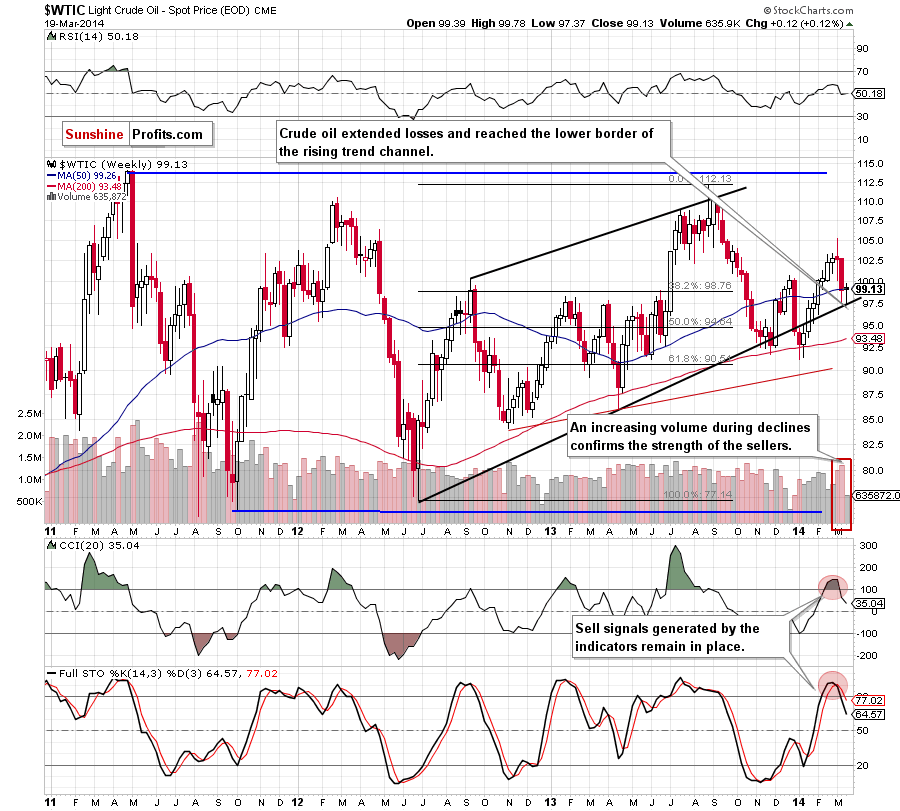
From this perspective, we see that crude oil reached the lower border of the rising trend channel, which explains the consolidation on the daily chart. On one hand, if this strong support encourages oil bulls to act, we may see a corrective upswing in the near future. However, taking into account the size of the volume that we noticed in the previous weeks (during earlier declines) and sell signals generated by the indicators, it seems that further deterioration is more likely – especially if the support line is broken (currently around $97.30).
Having discussed the current situation in light crude, let’s take a look at WTI Crude Oil (the CFD).
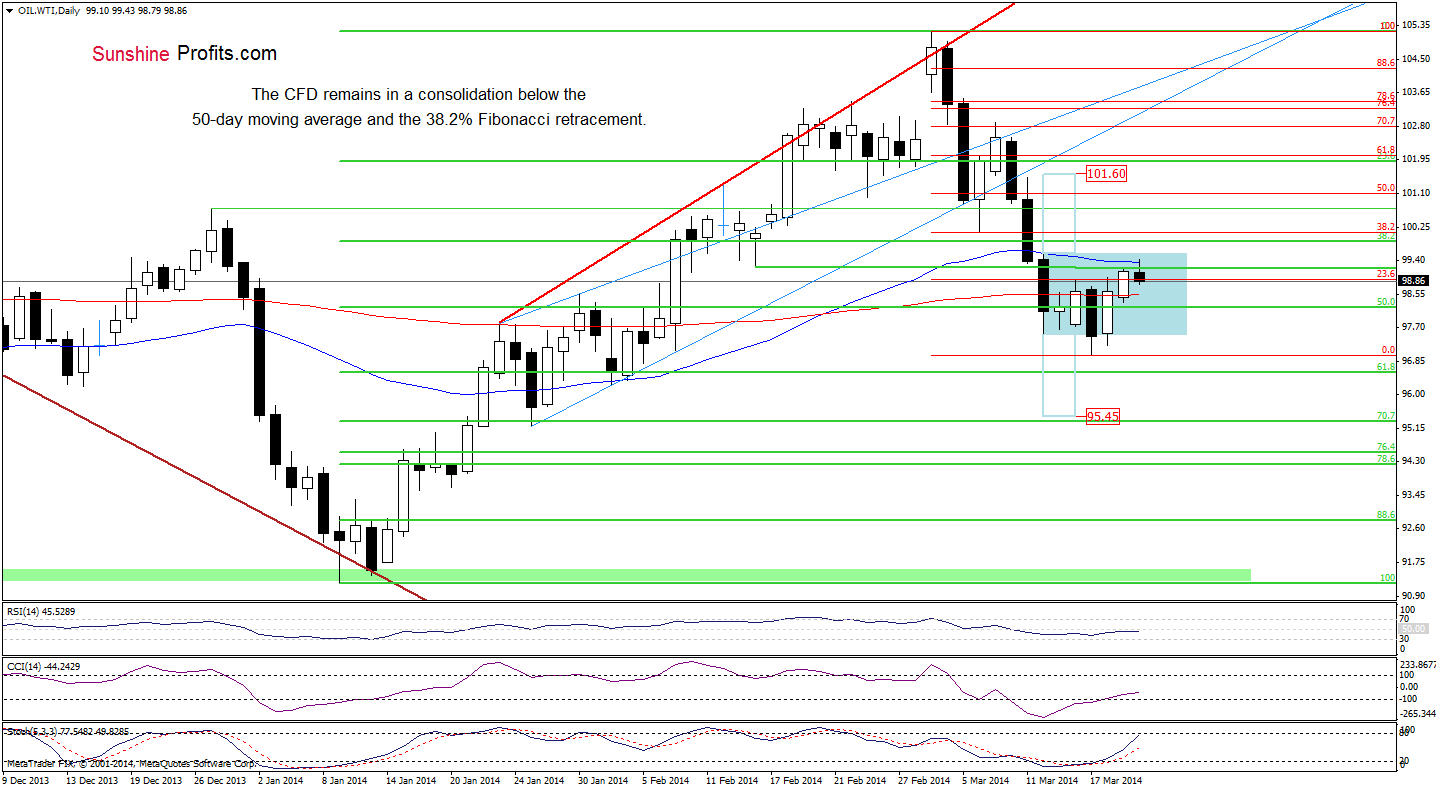
On the above chart, we see a situation has improved as the CFD extended gains and climbed to the 50-day moving average. Despite this corrective upswing, WTI Crude Oil still remains in a consolidation below the March 12 high. As you see on the daily chart, the combination of this resistance level and the 50-day moving average encouraged oil bears to act earlier today. From this perspective, it seems that we may see further deterioration and the first downside target would be the previously-broken 200-day moving average. If this support is broken, we will likely see a drop to the March low at $96.99.
Summing up, as mentioned earlier, the overall situation hasn’t changed much as crude oil remains in the consolidation below the strong resistance zone created by the red declining resistance line, the 200-day moving average and the 38.2% Fibonacci retracement. Additionally, sell signals generated by the indicators on the weekly chart support sellers at the moment. Taking all the above into account and combining with the current situation in the CFD (which reversed after reaching the resistance zone created by the March 12 high and the 50-day moving average), it seems that we may see another downswing after the market open.
Very short-term outlook: mixed with bearish bias
Short-term outlook: mixed with bearish bias
MT outlook: bullish
LT outlook: mixed
Trading position (short-term): Short. Stop-loss orders for crude oil and WTI Crude Oil (CFD): $102.95. We will keep you informed should anything change as far as our opinion is concerned, or should we see a confirmation/invalidation of the above.
Thank you.
Nadia Simmons
Forex & Oil Trading Strategist
Forex Trading Alerts
Oil Investment Updates
Oil Trading Alerts

