
Trading position (short-term; our opinion): Short. Stop-loss orders for crude oil and WTI Crude Oil (CFD): $102.95.
On Thursday, crude oil lost 0.52% on continued concerns about high domestic supplies and a strong U.S. dollar. Because of these circumstances, light crude finished the day below $99 per barrel.
On Wednesday, the U.S. Energy Information Administration showed that U.S. crude oil supplies have increased for nine straight weeks and are at their highest level since November. As a reminder, a sharp increase in crude oil inventories has helped send the price of light crude lower for three consecutive months at the end of last year. Therefore, another build in domestic supplies fueled concerns that the market may be adequately supplied and had a negative impact on the price.
Another bearish factor, which pushed light crude lower was a strong greenback. Yesterday, the U.S. currency rallied against major currencies after U.S. Federal Reserve commentary that interest rates could start rising in the fall. As a reminder, a rising greenback often softens oil prices by making the commodity less attractive on dollar-denominated exchanges.
Please note that today there is no significant U.S. economic data and it seems that the market attention will be on the substantial list of senior Fed officials speaking in public forums. On top of that, geo-political developments in Ukraine could also have impact on trading sentiment.
Having discussed the above, let’s move on to the technical changes in the crude oil market (charts courtesy of http://stockcharts.com.)
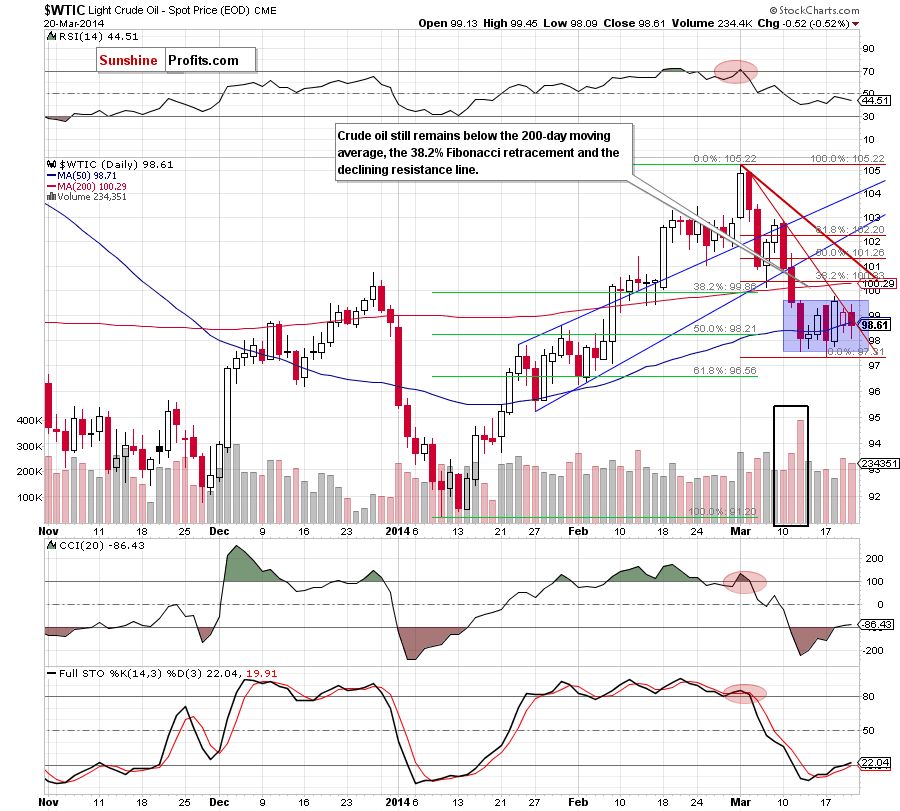
Looking at the daily chart, we see that the very short-term situation hasn’t changed much as crude oil still remains in a consolidation range. As you see on the above chart, oil bulls tried to push the price above the declining resistance line (marked with red) after the market open, but they failed. This show of weakness resulted in a decline and crude oil dropped not only below the resistance line, but also below the 50-day moving average, which is not a positive signal. Therefore, what we wrote in our last Oil Trading Alert is still up-to-date.
(…) If it encourages oil bears to act, we may see another attempt to move lower. If this is the case, the downside target will be the lower border of the consolidation range (around $97.55). However, if this line is broken, we may see further improvement and an increase to the 200-day moving average, which still serves as the major resistance (currently at $100.27). At this point it’s worth noting that this area is also reinforced by the 38.2% Fibonacci retracement based on the recent decline (around $100.33).
Please note that yesterday’s downswing materialized on relative big volume (especially when compared to the volume that we saw on Monday), which confirms the strength of the sellers at the moment.
Having discussed the current situation in light crude, let’s take a look at WTI Crude Oil (the CFD).
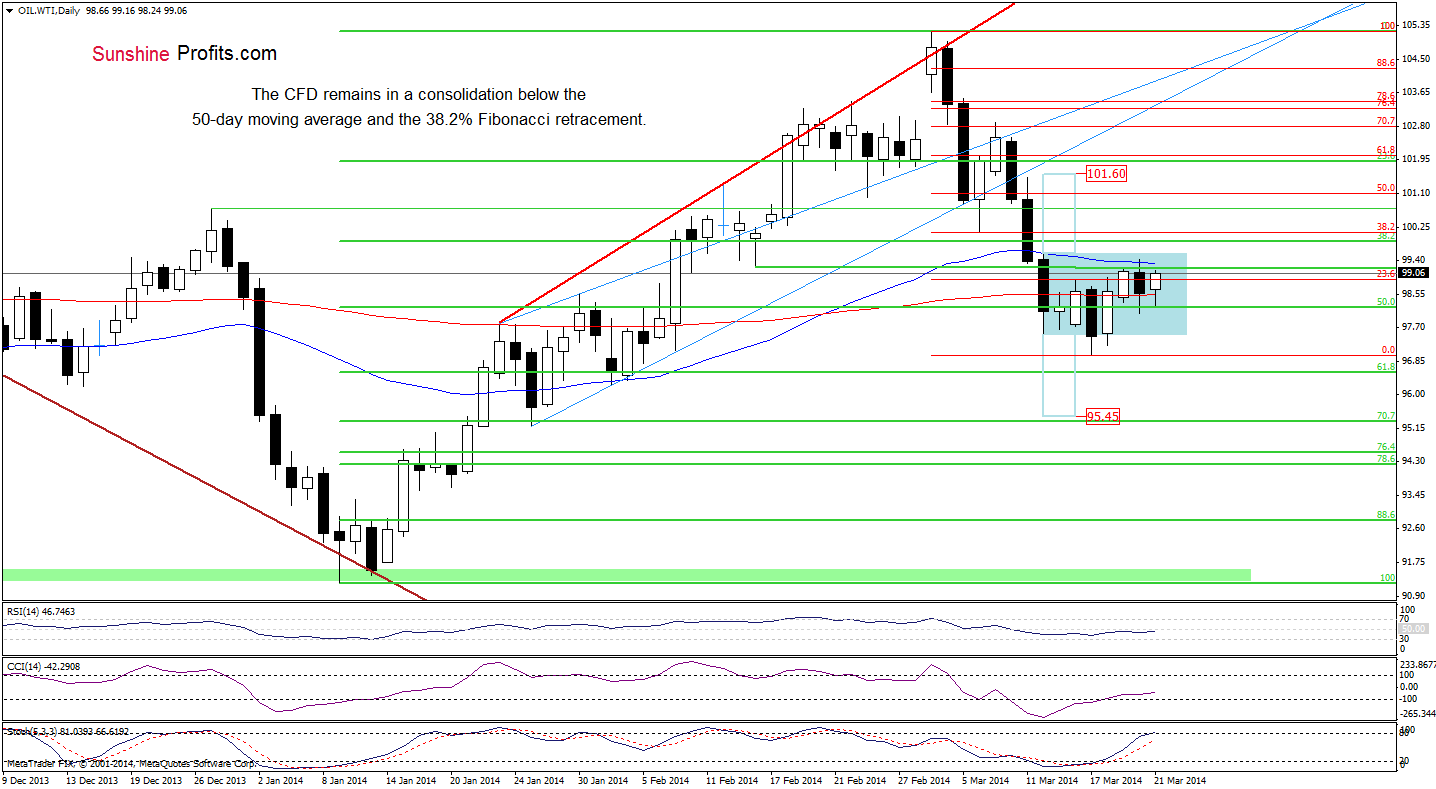
On the above chart, we see although WTI Crude Oil declined below its first downside target(the 200-day moving average) yesterday, the CFD reversed and rebounded earlier today. However, despite this corrective upswing, the price still remains below the 50-day moving average. From this perspective, the very short-term situation hasn’t changed much and it seems that we won’t see a bigger upswing (or downswing) as long as the CFD remains between the 50-day and 200-day moving averages. Taking these circumstances into account, we should consider two scenarios. On one hand, if WTI Crude Oil climbs above the 50-day moving average, we will likely see an increase above the upper line of a consolidation range (marked with a blue rectangle). In this case, the first upside target will be the 38.2% Fibonacci retracement at $100.08 (but the price target for the buyers after a breakout above the upper border of the consolidation is around $101.60). On the other hand, if oil bull fail and the price drops below the 200-day moving average, we will likely see a decline to the March low at $96.99.
Summing up, as mentioned earlier, the overall situation hasn’t changed much as crude oil remains in the consolidation below the strong resistance zone created by the red declining resistance line, the 200-day moving average and the 38.2% Fibonacci retracement. Additionally, yesterday’s downswing materialized on relative big volume, which confirms the strength of the sellers at the moment. The current situation in WTI Crude Oil doesn’t give us any particular clues about future crude oil moves as the CFD remains between the 50-day and 200-day moving averages, which keep further gains/declines in check.
Very short-term outlook: mixed with bearish bias
Short-term outlook: mixed with bearish bias
MT outlook: bullish
LT outlook: mixed
Trading position (short-term): Short. Stop-loss orders for crude oil and WTI Crude Oil (CFD): $102.95. We will keep you informed should anything change as far as our opinion is concerned, or should we see a confirmation/invalidation of the above.
Thank you.
Nadia Simmons
Forex & Oil Trading Strategist
Forex Trading Alerts
Oil Investment Updates
Oil Trading Alerts

