
Trading position (short-term): In our opinion no positions are justified from the risk/reward perspective.
On Friday, crude oil moved lower as U.S. economic data and profit taking weighted on the price. Despite a temporary drop, light crude reversed and erased losses closing the day above $100 per barrel.
On Friday, the Federal Reserve reported that U.S. industrial production fell 0.3% in January, missing expectations for a 0.3% rise after a 0.3% increase the previous month. However, later in the day, the University of Michigan showed that its consumer sentiment index remained unchanged at 81.2 this month, beating expectations for a fall to 80.6. The mixed data and the fact that the price of light crude have held near $100 a barrel all week encouraged some investors to cash out their gains ahead of a three-day weekend. Despite these circumstances, crude oil climbed 0.23% during the last week and it was the fifth consecutive weekly gain.
Having discussed the above, let’s move on to the technical changes in the crude oil market (charts courtesy of http://stockcharts.com.)
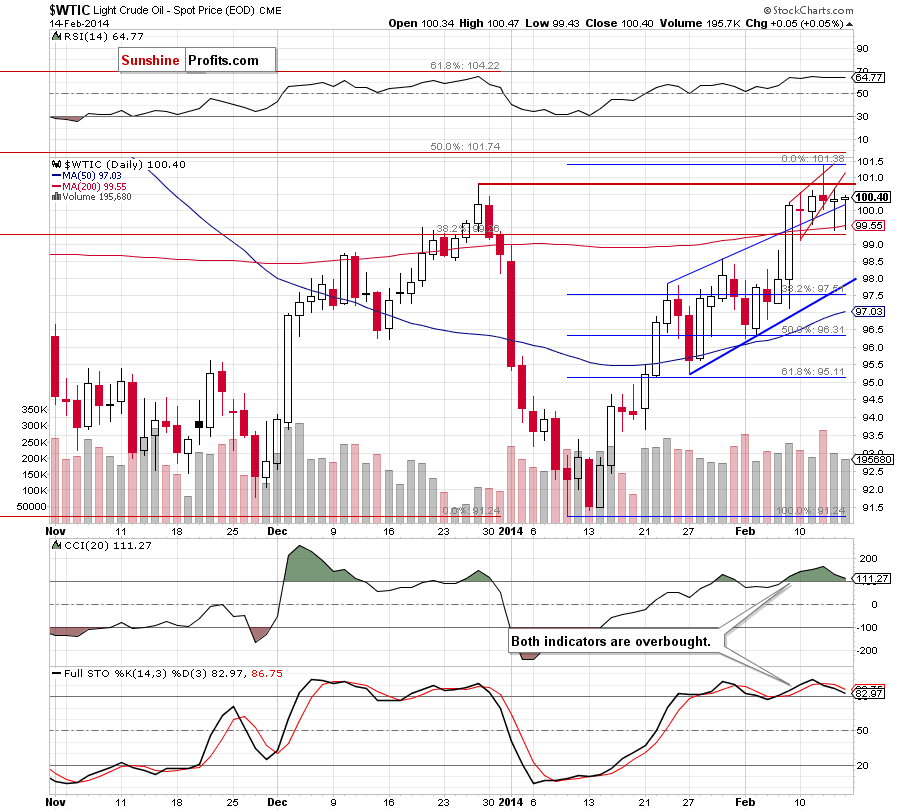
Looking at the above chart, we see that the situation hasn’t changed much as crude oil remains between the December high and the support zone. So, what we wrote in our last Oil Trading Alert is still up-to-date.
(…) light crude reached the 200-day moving average and almost touched the previously-broken 38.2% Fibonacci retracement level (…) this support zone encouraged buyers to act and crude oil rebounded. Despite this growth, light crude still remains below the lower border of a small rising wedge, which is not a positive sign – especially when we factor in the position of the indicators (they both are overbought and the Stochastic Oscillator generated a sell signal). So far, crude oil remains above the upper border of the rising trend channel, which supports buyers. However, if this important line is broken and the price drops below the 200-day moving average, we will likely see a downward move to the lower border of the rising trend channel (currently around $97.70). Please note that this area is supported by the 38.2% Fibonacci retracement level based on the recent rally.
Having discussed the current situation in light crude, let’s take a look at WTI Crude Oil (the CFD).
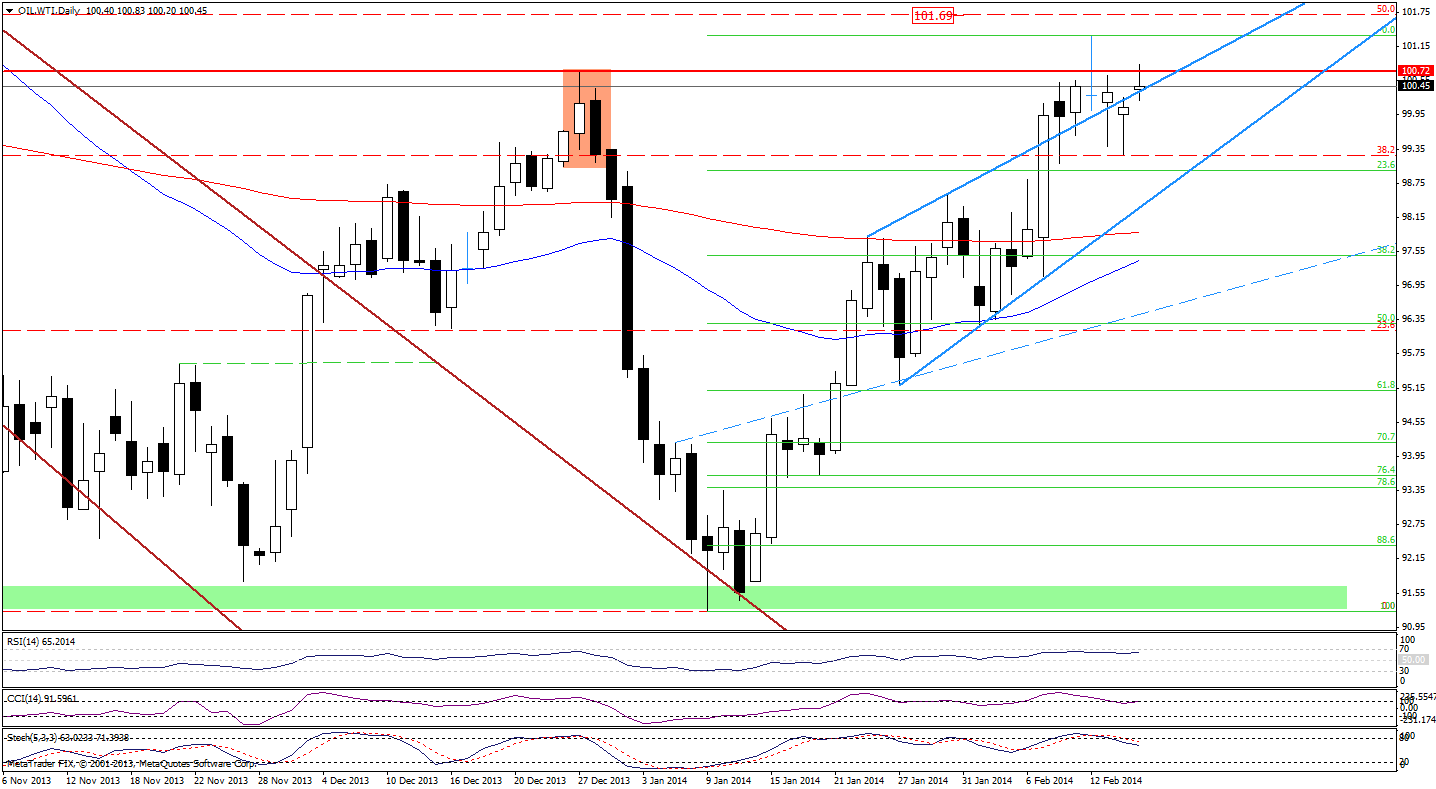
On the above chart, we see that although the CFD declined and closed slightly below the upper border of the rising trend channel/rising wedge, oil bulls didn’t give up and manage to push the price above this important line earlier today. Despite this growth, WTI Crude Oil still remains in a narrow range between the upper border of the rising trend channel (rising wedge) and the February high. From this perspective, it seems that as long as there is no breakout above the monthly high (or a breakdown below the major support line), a bigger upswing (or downswing) is not likely to be seen.
Please note that the first upside target for the buyers is the 50% Fibonacci retracement level based on the entire Aug-Jan. decline (around $101.70). However, looking at the position of the indicators (sell signals generated by the Stochastic Oscillator and CCI remain in place supporting oil bears), it seems that we may see another attempt to invalidate the breakout above the upper border of the rising trend channel (rising wedge) in the nearest future.
Summing up, although crude oil rebounded after a drop below the upper border of the rising trend channel, it still remains below the December low. Taking this fact into account, and combining with the position of the indicators and the current situation in the CFD (sell signals generated by the indicators), it seems that we will likely see another attempt to invalidate the breakout above the upper border of the rising trend channel in the coming day (or days). In this case, if the important support line is broken and the price drops below the 200-day moving average, we will likely see a downward move to (at least) the lower border of the rising trend channel (currently around $97.86).
Very short-term outlook: mixed
Short-term outlook: bullish
MT outlook: bullish
LT outlook: mixed
Trading position (short-term): In our opinion, as long as there is no an invalidation of the breakout above the upper line of the rising trend channel, the situation will not be bearish enough to justify opening short positions. However, if crude oil declines below the 200-day moving average, we might consider opening short positions. We will keep you informed should anything change, or should we see a confirmation/invalidation of the above.
Thank you.
Nadia Simmons
Forex & Oil Trading Strategist
Forex Trading Alerts
Oil Investment Updates
Oil Trading Alerts

