
Trading position (short-term; our opinion): Short. Stop-loss orders for crude oil and WTI Crude Oil (CFD): $102.95.
On Monday, crude oil lost 0.13% as weaker than expected manufacturing data weighted on the price. In this way, light crude slipped under $100 per barrel and closed the day below this important barrier once again.
Although concerns about economic sanctions against Russia and their impact on Russian oil exports have supported the price of light crude, which resulted in an increase above $100, weaker than expected manufacturing data capped gains and pushed crude oil below this important barrier once again.
Yesterday’s data showed that China’s HSBC Flash Purchasing Managers Index fell to an eight-month low of 48.1 in March from a final reading of 48.5 in February (while analysts had expected an increase to 48.7). This disappointing manufacturing data fuelled concerns over slowing growth in the world’s second largest oil consumer.
Additionally, later in the day, market research group Markit said that its preliminary U.S. PMI fell to a seasonally adjusted 55.5 in March from a final reading of 57.1 in February (while analysts had expected a drop to 56.5 in March).
Having discussed the above, let’s move on to the technical changes in the crude oil market (charts courtesy of http://stockcharts.com.)
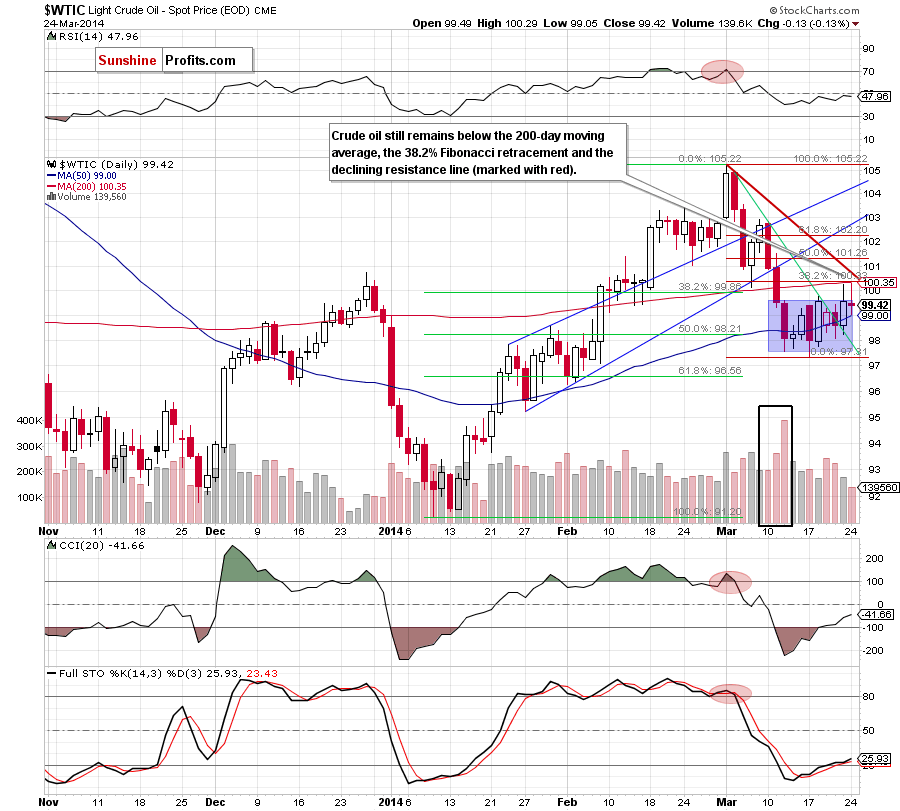
Looking at the above chart we see that there was another attempt to break above $100, but a strong resistance zone created by the 200-day moving average and the 38.2% Fibonacci retracement successfully stopped further improvement and encouraged oil bears to act (just like on Friday). In this way, light crude reversed and declined to the consolidation range (marked with a blue rectangle) once again. From this perspective, it seems that as long as crude oil remains below the resistance zone, a bigger upward move is not likely to be seen. Please note that, slightly above the resistance is also the declining resistance line (marked with red), which reinforces this area (currently around $100.40).
Having discussed the current situation in light crude, let’s take a look at WTI Crude Oil (the CFD).
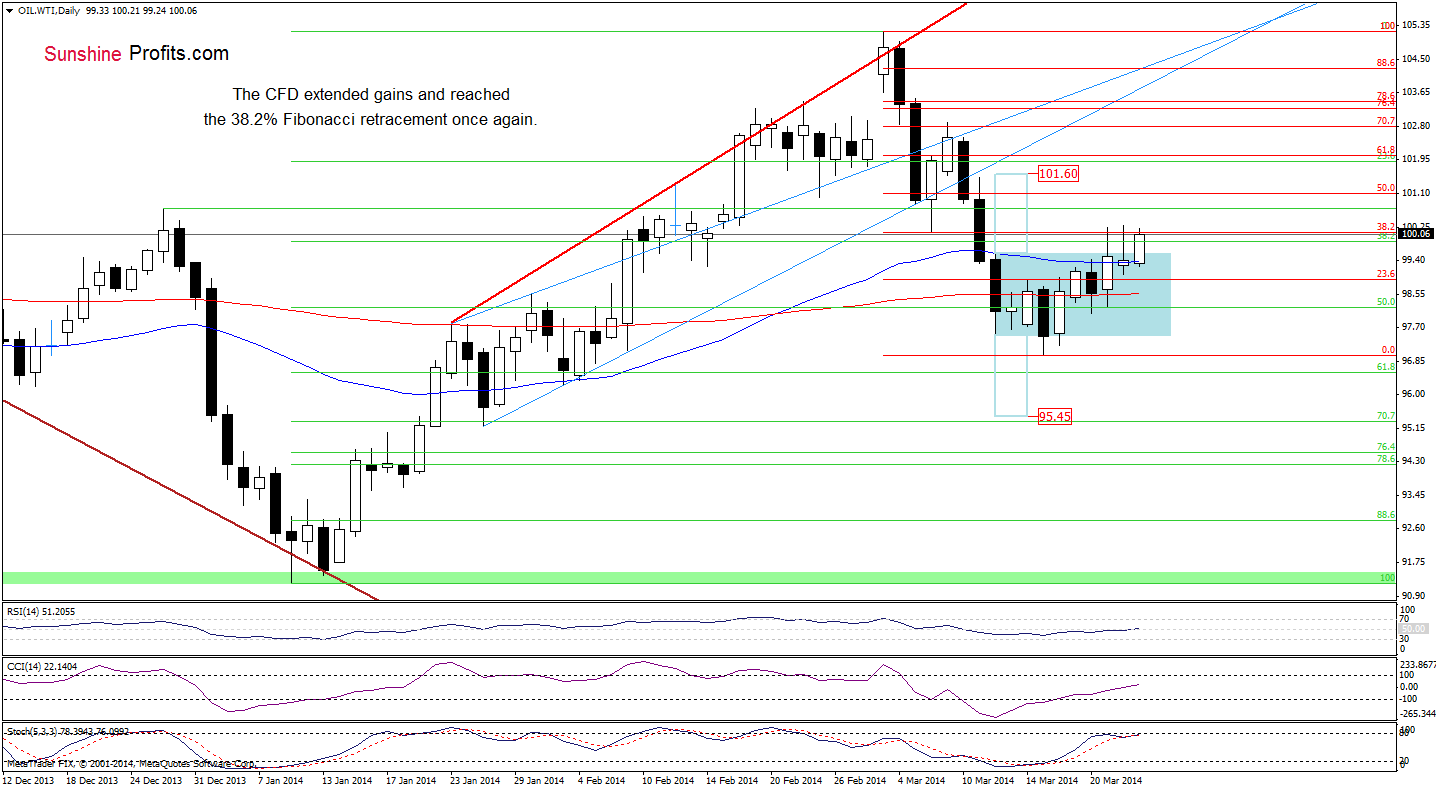
Yesterday, WTI Crude Oil reached the 38.2% Fibonacci retracement, but reversed in the following hours and slipped to the consolidation range (similarly to what we saw in the case of light crude). Despite this drop, oil bulls didn’t give up and break above the upper line of the consolidation earlier today, reaching the 38.2% Fibonacci retracement once again. If this resistance holds, we will likely see another pullback to the consolidation range in the following hours. However, if it is broken, we may see an increase to the 50% Fibonacci retracement (or even to $101.60).
Summing up, although we saw the second attempt to break above the 200-day moving average and the 38.2% Fibonacci retracement, oil bulls failed and the price declined to the consolidation range once again. The current situation in WTI Crude Oil suggests that we may see another attempt to move higher (in the case of light crude) after the market open. However, as mentioned earlier, as long as crude oil remains below the resistance zone, a bigger upward move is not likely to be seen.
Very short-term outlook: mixed with bearish bias
Short-term outlook: mixed with bearish bias
MT outlook: bullish
LT outlook: mixed
Trading position (short-term): Short. Stop-loss orders for crude oil and WTI Crude Oil (CFD): $102.95. We will keep you informed should anything change as far as our opinion is concerned, or should we see a confirmation/invalidation of the above.
Thank you.
Nadia Simmons
Forex & Oil Trading Strategist
Forex Trading Alerts
Oil Investment Updates
Oil Trading Alerts

