
Trading position (short-term; our opinion): Speculative short positions in crude oil seem to be justified from the risk/reward perspective.
On Thursday, crude oil climbed to an intraday high of $100.93 supported by the upbeat U.S. and Chinese data. However, later in the day, the commodity gave up the gains as traders who had bet on higher price locked in their profits after Wednesday's rally. As a result, light crude temporarily slipped below the psychological barrier of $100 once again. It is possible that we will not see crude oil above $101 in the coming days?
Yesterday, official data showed that China’s trade surplus widened to $18.45 billion in April from a surplus of $7.7 billion in March, compared to estimates for a surplus of $13.9 billion. Meanwhile, Chinese exports climbed 0.9% from a year earlier, beating expectations for a 1.7% decline, while imports rose 0.8%, compared to forecasts for a 2.3% decline and after plunging 11.3% in the previous month. Additionally, later in the day, the U.S. Department of Labor showed that initial claims for jobless benefits in the week ending May 3 fell by 26,000 to a seasonally adjusted 319,000, while analysts had expected jobless claims to fall by 20,000 to 325,000 last week.
These better-than-expected numbers from the world's largest and second-largest consumers of crude supported the growth-sensitive commodity and resulted in an increase to Wednesday high (as a reminder, the price of light crude climbed to a 1-week high after the EIA weekly report showed that U.S. oil supplies fell last week, contrary to analyst expectations that stocks would rise to a new record high). As we mentioned earlier, traders who had bet on higher price locked in their profits at these levels, which triggered a pullback that took (only temporarily, but still) light crude below the key level of $100.
Is it possible that oil traders also noticed some warning technical signs that encouraged them to push the sell button? Let’s find out and take a closer look at the charts below (charts courtesy of http://stockcharts.com).
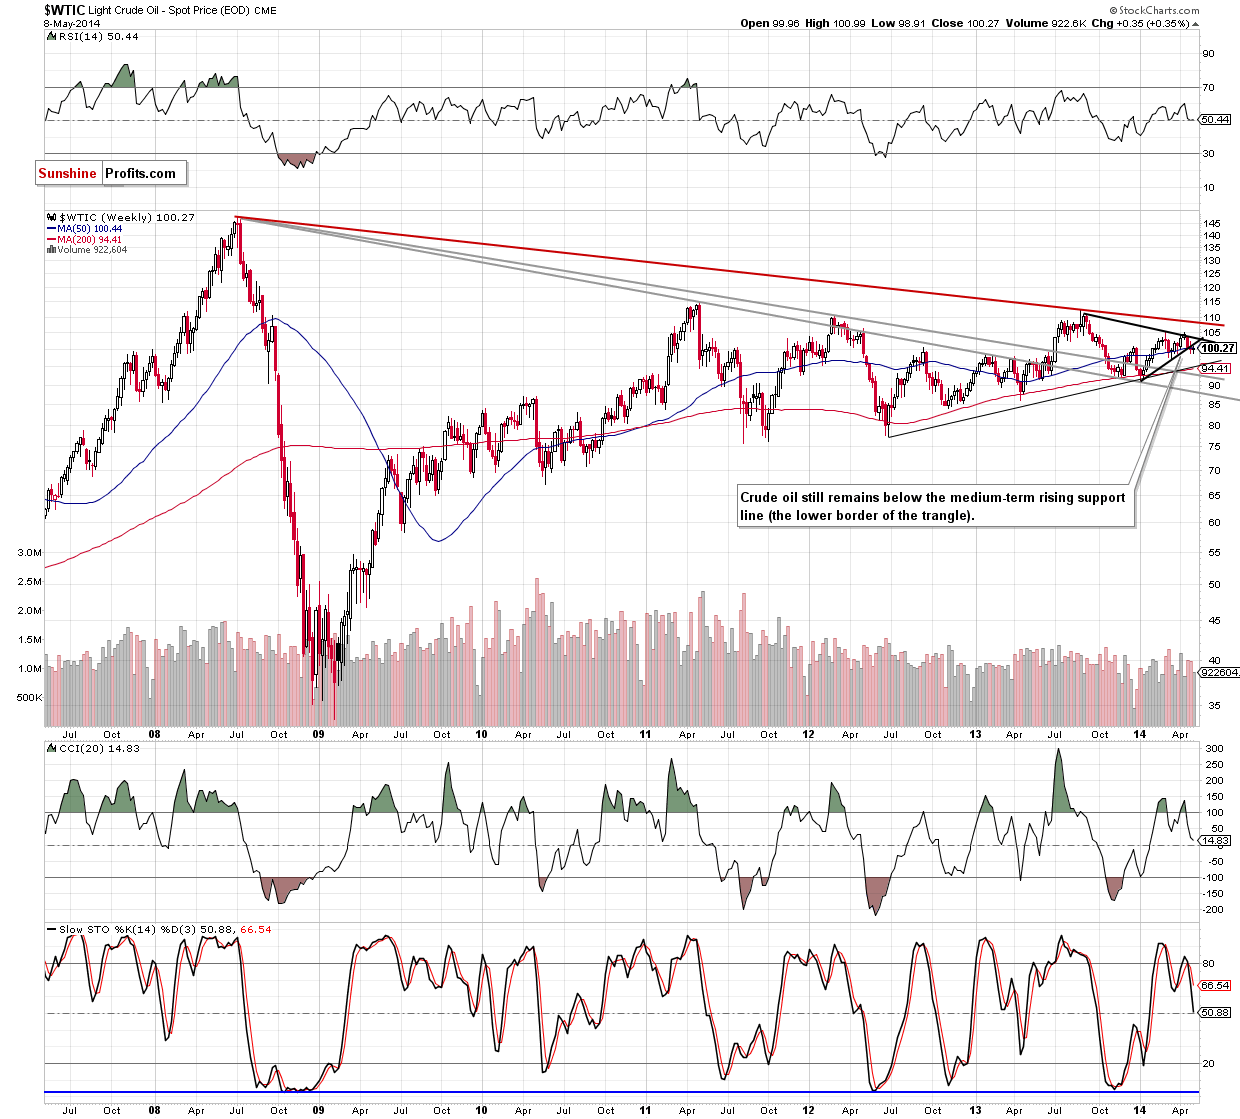
As it is clear from the chart above, the medium-term situation hasn’t changed much as crude oil still remains below the lower border of the triangle. Therefore, the bearish scenario from our Oil Trading Alert posted on Apr. 30 is still up-to-date:
(…) if the commodity extends losses and drops below the psychological barrier of $100, we will likely see further deterioration and a drop even to around $95, where the medium-term support line (based on the June 2012 and January 2014 lows) is. At this point, it’s worth noting that the CCI and Stochastic Oscillator generated sell signals, which suggests that another attempt to move lower should not surprise us.
Will the short-term chart give us more precise clues about future moves? Let’s zoom in on our picture and find out.
Quoting our last Oil Trading Alert:
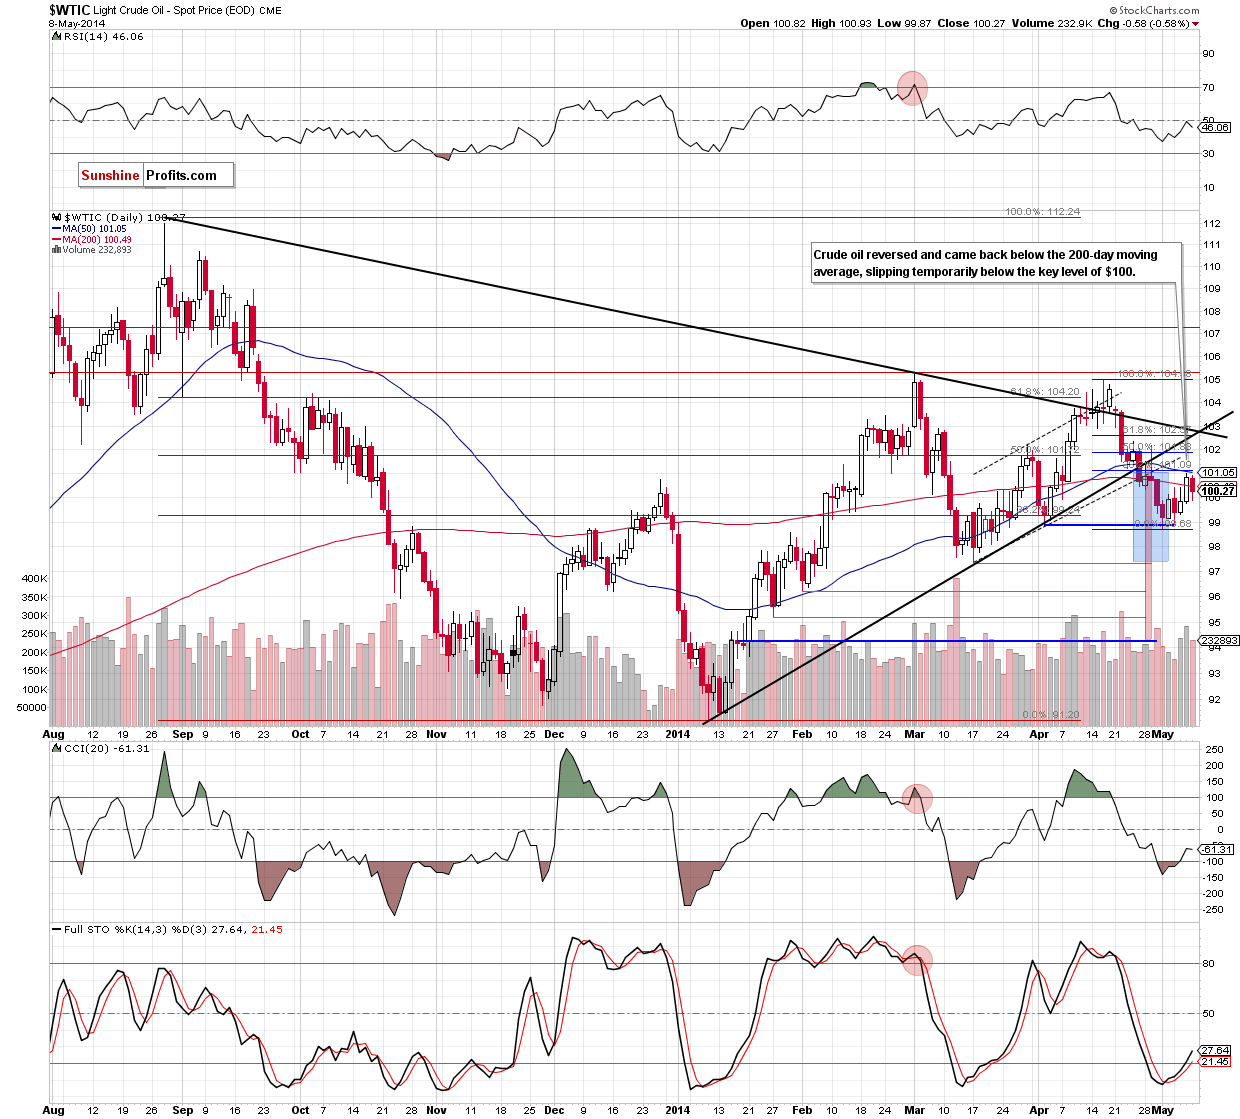
(…) The commodity not only still remains below two major resistance lines (the medium-term black line and the lower border of the rising trend channel), but also reached a resistance zone created by the 50-day moving average and the 38.2% Fibonacci retracement based on the entire recent declines. (…) if this area holds, we will see a pullback to the 200-day moving average and if it’s broken, the commodity could easily drop below $100 once again.
As you see on the above chart, we noticed such price action yesterday. What does it mean for crude oil? Technically, we have another breakdown below the 200-day moving average, which is a bearish signal. As a result, there is the threat (or rather the chance in the case of oil bears) of returning to declines. In our opinion, the moment of truth for crude oil will occur when the commodity declines to the bottom of the correction that we saw at the turn of March and April (which corresponds to the May low). If oil investors push the sell button in this area, and crude oil extends declines, the commodity will likely drop to one of its downside targets that we discussed in our Oil Trading Alert posted on May 2nd:
(…) In the case of the breakdown under the lower border of the trend channel, declines may push the price to around $97, where the size of the downswing will correspond to the height of the formation. Nevertheless, in our opinion, the confirmation of the breakdown below the medium-term line is more important because it suggests an even bigger move. In this case, the correction may be deeper and take light crude to around $94.20. At this point, it’s worth noting that the first downside target is supported by the March low of $97.37 and the latter corresponds to the 78.6% Fibonacci retracement based on the entire Jan.-March rally.
Nevertheless, please keep in mind that as long as the price remains above the key level of $100, another attempt to move higher should not surprise us. At this point, it’s worth noting that if crude oil rebounds (and even comes back above the 200-day moving average - currently at $100.49), the resistance zone created by the 50-day moving average and the 38.2% Fibonacci retracement, will likely pause or stop further improvement once again. Please note that even if the commodity climbs above this area and reaches the next Fibonacci retracement, the breakdown below the major resistance lines and its consequences still will be in play.
Summing up, the highlight of yesterday's session is another breakdown below 200-day moving average, which is a warning signal for oil bulls. Despite this drop, crude oil still remains above the psychological barrier of $100. If it holds, another attempt to move higher will not surprise us and we tink that the upside target will be the nearest resistance zone (around $101.05-$101.13). However, if declines continue and crude oil drops below $100 once again, we will likely see a pullback to the May low in the near future. Connecting the dots, we remain bearish.
Very short-term outlook: bearish
Short-term outlook: bearish
MT outlook: mixed
LT outlook: mixed
Trading position (short-term): Short. Stop-loss order: $102.50. We will keep you informed should anything change, or should we see a confirmation/invalidation of the above.
Thank you.
Nadia Simmons
Forex & Oil Trading Strategist
Przemyslaw Radomski, CFA
Founder, Editor-in-chief
Gold & Silver Trading Alerts
Forex Trading Alerts
Oil Investment Updates
Oil Trading Alerts

