
Trading position (short-term; our opinion): In our opinion no positions are justified from the risk/reward perspective.
On Monday, crude oil lost 0.07% as manufacturing activity in the Chicago-area slowed to the weakest level since August in March and Federal Reserve Chair Janet Yellen commentary weighted on the price. Despite these circumstances, light crude closed the day above $101 once again.
Yesterday, data showed that the Chicago PMI fell to 55.9 in March (from 59.8 in February), while analysts had expected a drop to 59.0 this month. Additionally, crude oil extended losses after Federal Reserve Chair Janet Yellen commentary. Ms. Yellen said that the Fed’s commitment to economic stimulus will still be needed for some time as “considerable slack” still remained in the labor market. These negative circumstances fueled concerns on Fed's stimulus reduction and the impact on future oil demand prospects. In reaction to this, light crude extended losses and dropped to an intraday low of $100.88. However, later in the day, crude oil reversed and finally finished the day only 7 cents below the Friday’s closing price.
Having discussed the above, let’s move on to the technical changes in the crude oil market (charts courtesy of http://stockcharts.com.)
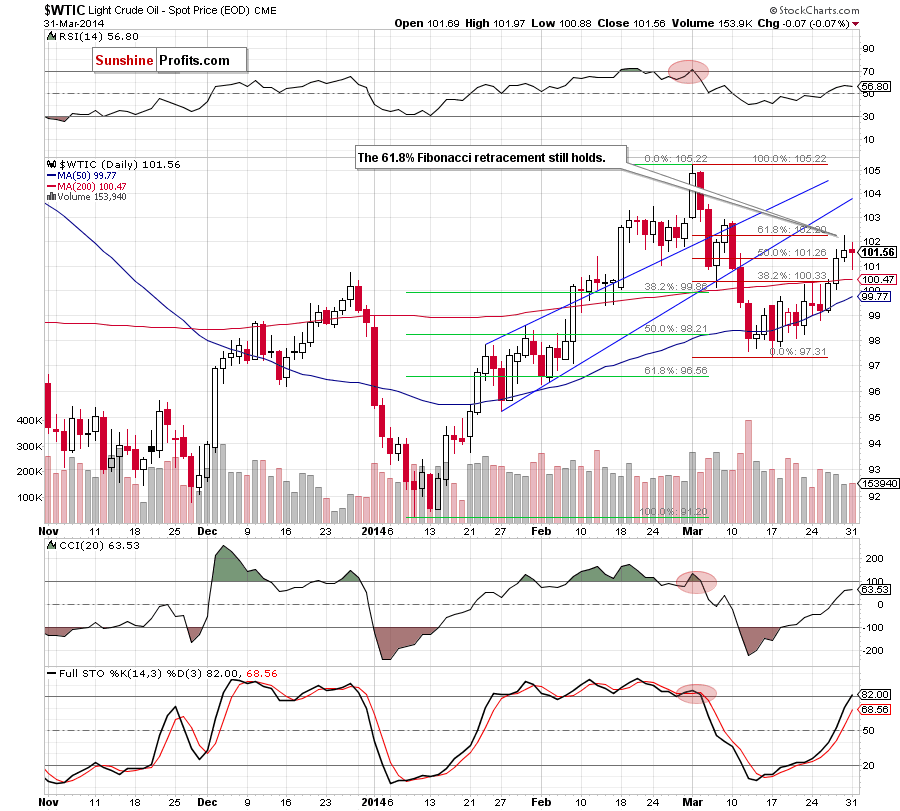
Looking at the above chart, we see that crude oil gave up some gains and still remains below the 61.8% Fibonacci retracement. Therefore, what we wrote in our last Oil Trading Alert is still up-to-date.
(…) If this resistance level encourages oil bears to act, we may see a pullback in the coming day (or days). If this is the case, the first downside target will be the previously-broken 200-day moving average (currently at $100.45). However, if this resistance is broken, light crude will likely increase to the 70.7% Fibonacci retracement (around $102.92), which corresponds to the March 7 high.
Having discussed the current situation in light crude, let’s take a look at WTI Crude Oil (the CFD).
Quoting our last Oil Trading Alert:
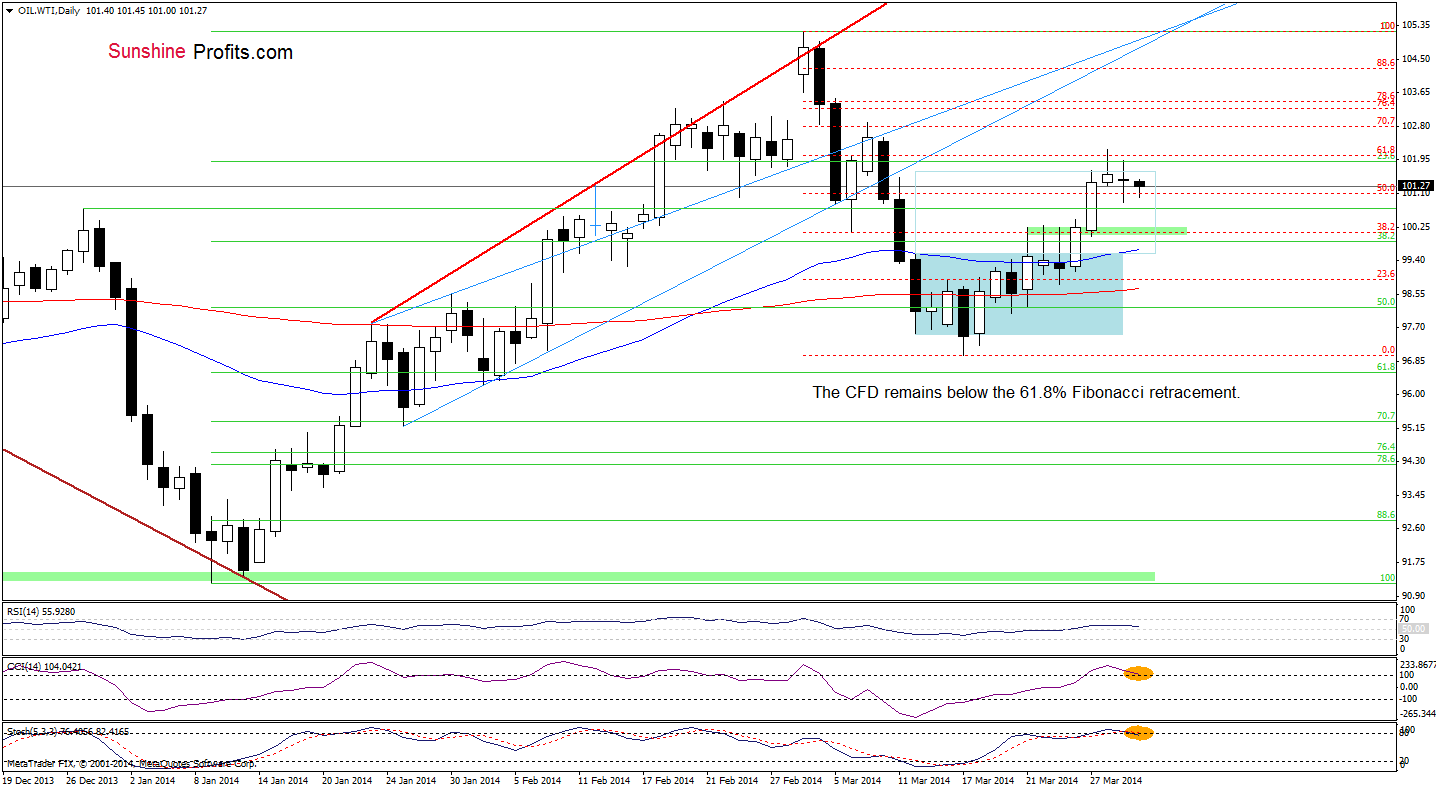
(…)WTI Crude Oil extended gains and broke above the 61.8% Fibonacci retracement on Friday. However, this improvement was only very temporarily and the CFD gave up the gains in the following hours (…) If this resistance encourages sellers to act, we may see a pullback to the previously-broken 50% Fibonacci retracement.
Looking at the daily chart, we see that WTI Crude Oil extended losses and reached the first downside target yesterday. Earlier today, the situation hasn’t changed much as the CFD remains between yesterday’s high and low. Taking this fact into account, we should consider two scenarios. On one hand, if oil bulls do not give up and push the price above Monday’s high, we may see an increase to the 70.7% Fibonacci retracement (around $102.79), which is reinforced by the March 7 high. On the other hand, if they fail, we will likely see further deterioration and the first downside target will be around $100.22, where the 38.2% Fibonacci retracement (based on the entire recent increase) is. Looking at the current position of the indicators, we see that the CCI and Stochastic Oscillator are overbought and very close to generating sell signals, which suggests that a bearish scenario is more likely to be seen in the following hours. Additionally, we still should keep in mind that the CFD remains in the rising trend channel (seen on the 4-hour chart below).
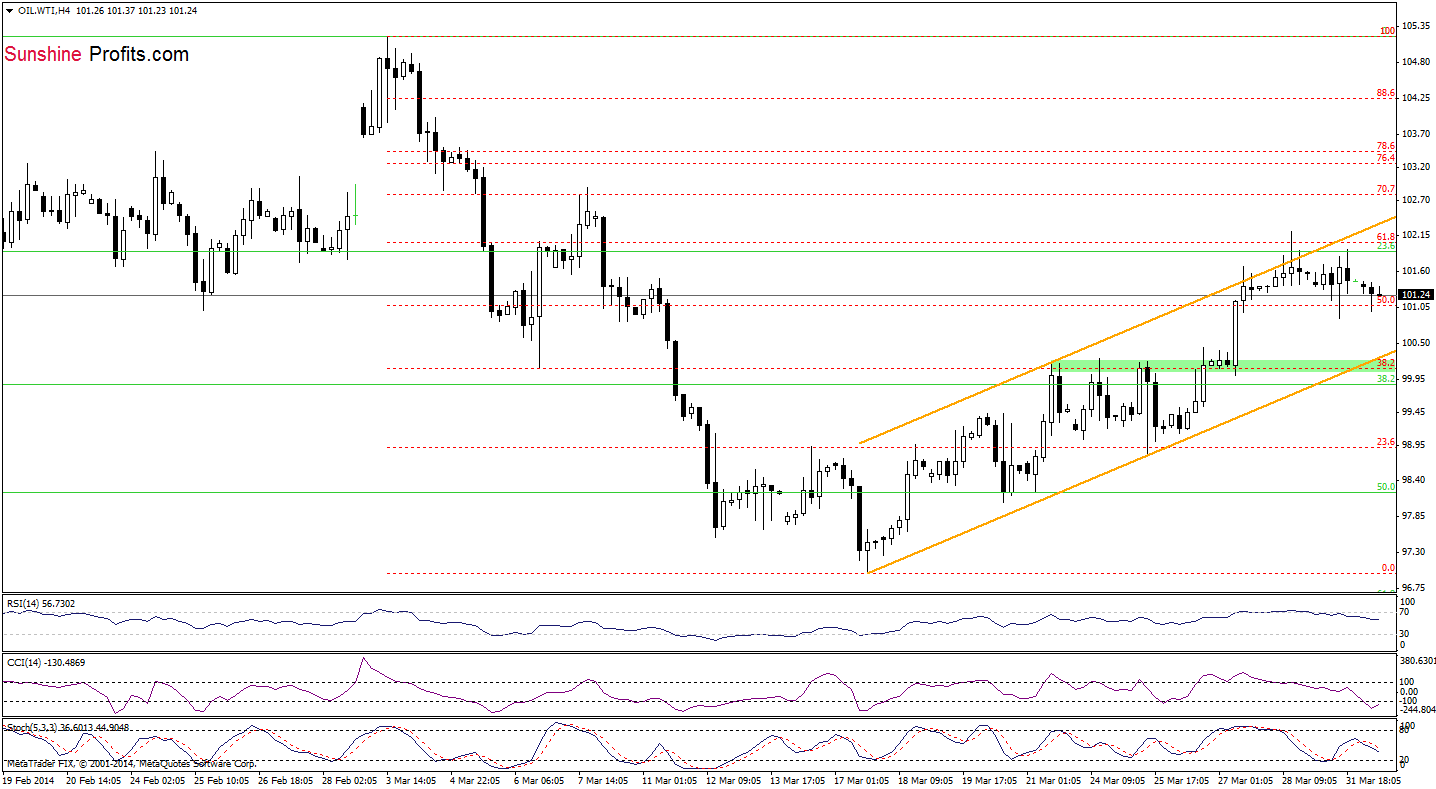
From this perspective, we see that if the CFD extended losses, we will likely see a drop to the lower border of this formation, which corresponds to the above mentioned 38.2% Fibonacci retracement based on the entire recent increase.
Summing up, the short-term situation hasn’t changed much as crude oil remains below the 61.8% Fibonacci retracement. However, the current situation in WTI Crude Oil suggests that a pullback is just around the corner (the CFD remains below the strong resistance zone, while the daily CCI and Stochastic Oscillator are very close to generating sell signals). Connecting the dots, if the CFD declines before the market open, it will have a negative impact on light crude and we will also see further deterioration in crude oil.
Very short-term outlook: mixed
Short-term outlook: mixed
MT outlook: bullish
LT outlook: mixed
Trading position (short-term): In our opinion no positions are justified from the risk/reward perspective. We will keep you informed should anything change as far as our opinion is concerned, or should we see a confirmation/invalidation of the above.
Thank you.
Nadia Simmons
Forex & Oil Trading Strategist
Forex Trading Alerts
Oil Investment Updates
Oil Trading Alerts

