
Trading position (short-term): No significant improvement and no positions.
On Thursday, crude oil lost 0.15% as profit taking after a two-day rally pushed the price lower. However, light crude erased most of earlier losses after upbeat U.S. economic data and closed the day slightly above $94 per barrel.
Yesterday, crude oil moved lower as oil investors took profits from the previous day’s rally which had taken prices to a two-week high. However, in the following hours light crude reversed course after upbeat U.S. data which bolstered sentiment on the economic outlook.
The Labor Department said in its report that initial claims for jobless benefits decreased by 2,000 to a seasonally adjusted 326,000 in the week ended Jan. 11 (while economists had expected 330,000 new claims for the week). Although this is the smallest number in six weeks, it indicated continued improvement in the labor market.
A separate report showed that the U.S. consumer-price index, which measures how much Americans pay for everything, rose a seasonally adjusted 0.3% in December, matching forecasts, after holding flat in November. Core consumer prices, which exclude food and energy costs, inched up 0.1% last month, meeting estimates. Core consumer prices rose 0.2% in November.
Additionally, the price of light crude strengthened after the Federal Reserve Bank of Philadelphia said that its manufacturing index improved to 9.4 this month from December’s reading of 6.4 (analysts had expected the index to rise to a reading of 8.6 in January).
Having discussed the above, let’s move on to the technical changes in the crude oil market (charts courtesy of http://stockcharts.com.)
Quoting our last Oil Trading Alert:
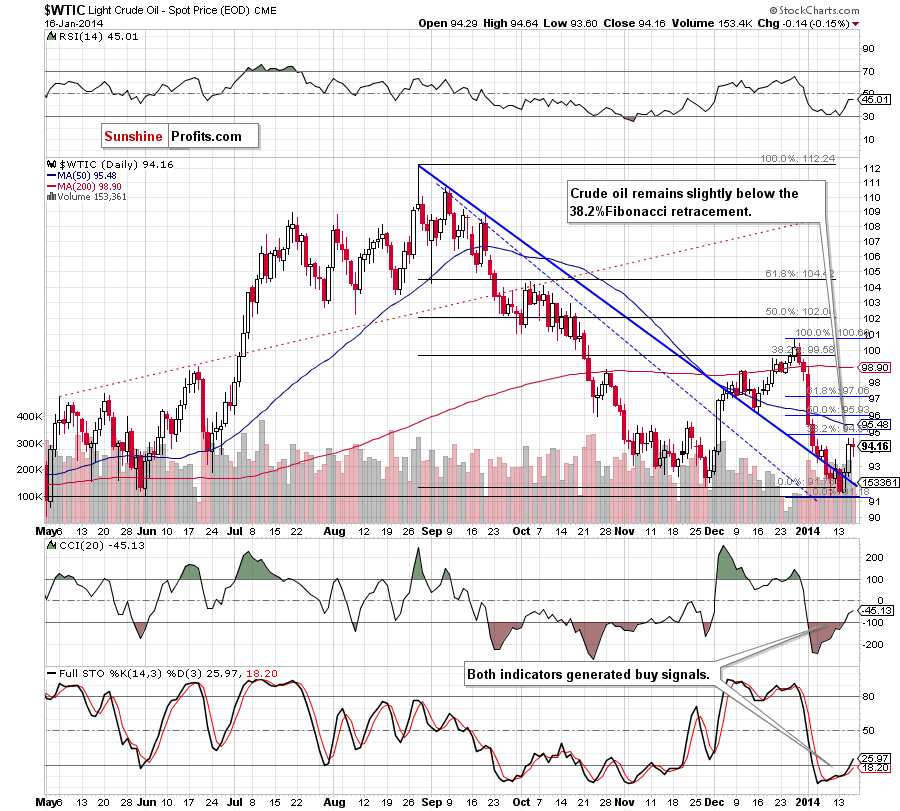
(…) light crude approached the 38.2% Fibonacci retracement level. On one hand, this resistance may encourage sellers to act and result in a pullback in the coming day (or days). On the other hand, if the buyers push the price above this level, we will likely see further improvement and the first upside target will be the previously broken 50-day moving average.
Looking at the above chart, we see that the situation hasn’t changed much. Although the proximity to the 38.2% Fibonacci retracement encouraged oil bears to push the price lower, this downswing seems to be insignificant – especially when we take into account the size of the recent daily candlesticks (and the size of the volume on which they materialized). Additionally, buy signals generated by the indicators remain in place supporting oil bulls. Therefore, another attempt to move above the nearest resistance level (38.2% Fibonacci retracement) should not surprise us.
Please keep in mind that despite Wednesday’s increase, crude oil still remains below the previously-broken medium-term support/resistance line. From this perspective, it seems justified to wait for an invalidation of the breakdown before opening long positions.
Having discussed the current situation in light crude, let’s take a look at WTI Crude Oil (the CFD).
In our last Oil Trading Alert, we wrote:
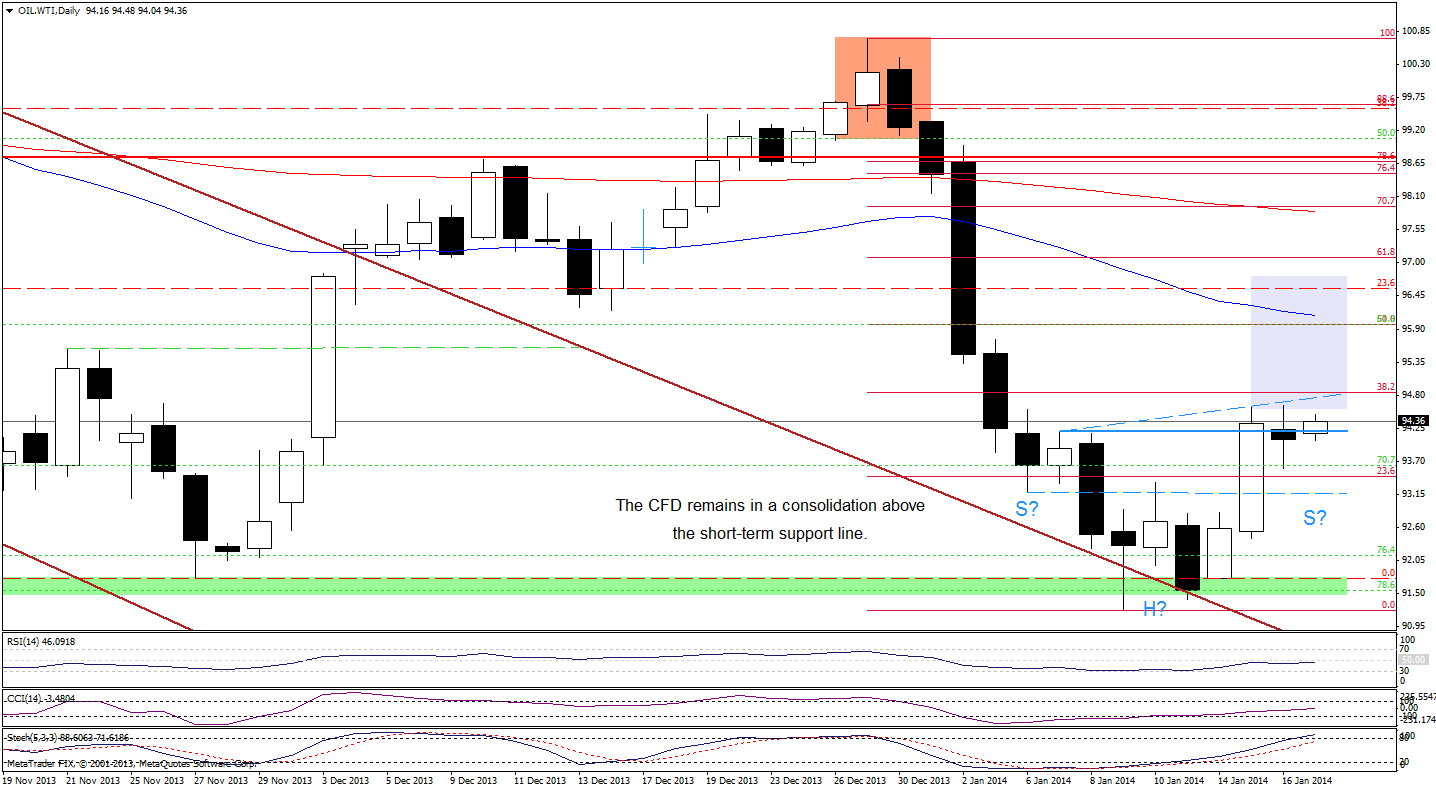
(…) although WTI Crude Oil approached the 38.2% Fibonacci retracement level, the buyers didn’t manage to push the price higher (…) the proximity to this resistance encouraged sellers to act and resulted in a small decline. From today’s point of view an upward corrective move is quite shallow and a pullback in the coming day (or days) should not surprise us. At this point, it’s worth noting that if we see such price action and the CFD rebounds (after a drop to around $93.19), we will likely see a reverse head and shoulders formation, which would be a strong bullish signal.
On the above chart, we see that oil bears didn’t manage to push the price to around $93.19 (the decline reached to an intraday low of $93.58), but a reverse head and shoulders formation is still in play. Additionally, recent days have formed a consolidation on the above chart. If the CFD breaks above Wednesday’s high (an additional confirmation of the bullish scenario would be a breakout above the blue dashed line, which intersects with the 38.2% Fibonacci retracement level at the moment), we will likely see further improvement and the upside price target for this pattern will be around $96.76 (slightly below the 61.8% Fibonacci retracement).
Once we know the above, let’s take a look at the NYSE Arca Oil Index (XOI) chart.
In our previous Oil Trading Alert, we wrote the following:
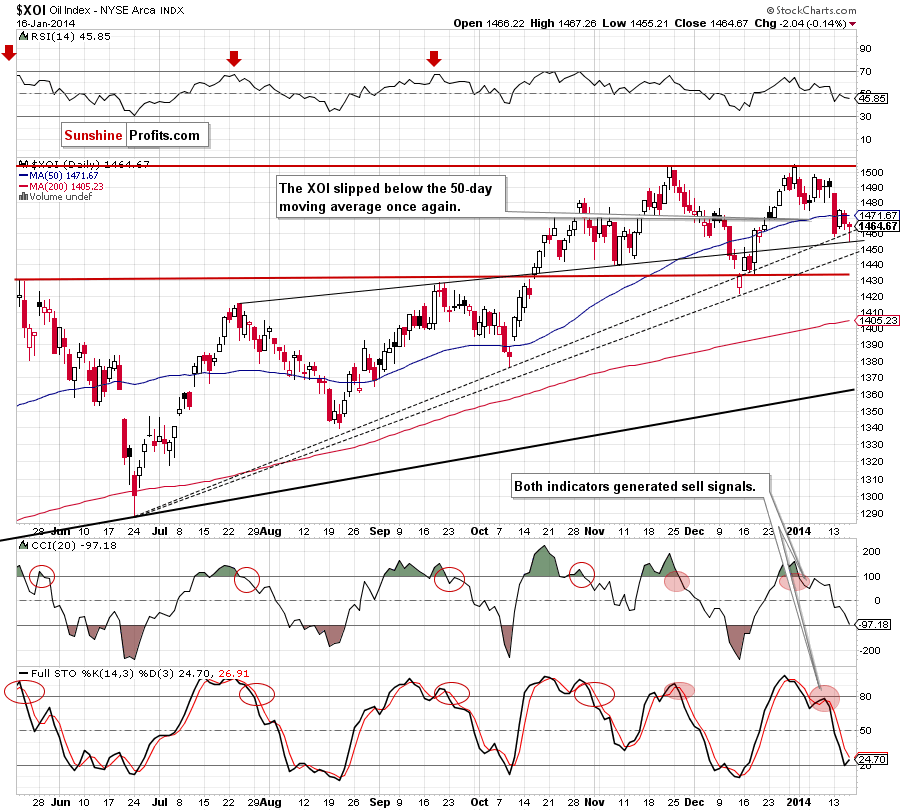
(…) the XOI quickly gave up (small) gains and reversed, which triggered a downswing that took the index below the 50-day moving average once again. This is a bearish signal, which will likely encourage sellers to act. If this is the case, the first support level will be Monday’s low and the next will be the 61.8% Fibonacci retracement level around 1,453.
Yesterday, the oil stock index declined once again as expected and dropped to the 61.8% Fibonacci retracement level. As you see on the above chart, this retracement level intersects with the upper line of the rising wedge, which is also the medium-term support line. Therefore, such strong support could encourage buyers to act. In this case, the first upside target will be the previously-broken 50-day moving average and Tuesday’s high at 1,475. On the other hand (taking into account sell signals generated by the indicators), if this strong support is broken, the next downside target will be the medium-term rising support line based on the June and December lows (currently around 1,445).
Summing up, although crude oil declined, this corrective move was quite shallow (it didn’t even erase 38.2% of the recent rally), which is a positive sign. Taking into account buy signals generated by the indicators and the situation in the CFD, it seems that we could see another attempt to move above the 38.2% Fibonacci retracement level. If light crude breaks this resistance, we may see further increases (which will likely accelerate if crude oil invalidates the breakdown below the medium-term support/resistance line – currently around $94.70). Nevertheless, we should keep in mind that oil still remains below the previously-broken medium-term support/resistance line. Taking this important fact into account, it seems justified to wait for an invalidation of the breakdown before opening long positions.
Very short-term outlook: bullish
Short-term outlook: mixed
MT outlook: mixed
LT outlook: mixed
Trading position (short-term): We do not suggest opening any positions at the moment. We will keep you informed should anything change, or should we see a confirmation/invalidation of the above.
Thank you.
Nadia Simmons
Forex & Oil Trading Strategist
Forex Trading Alerts
Oil Investment Updates
Oil Trading Alerts

