
Trading position (short-term): In our opinion no positions are justified from the risk/reward perspective.
On Thursday, crude oil declined after disappointing U.S. economic data, but reversed and erased earlier losses on expectations that an intense winter storm across the East Coast will increase demand for heating oil.
Yesterday, the Commerce Department reported that U.S. retail sales fell 0.4% in January, disappointing expectations for a 0.3% increase. Additionally, core retail sales, which exclude automobile sales, were unchanged last month, compared to forecasts for a 0.1% increase. Also yesterday, the Labor Department said in its report that initial claims for jobless benefits rose by 8,000 to 339,000 from the previous week’s total of 331,000 (analysts had expected jobless claims to fall by 1,000). Please note that the increase in new jobless claims is a worrying sign (especially after last week's payrolls report, which showed soft job gains), which underlines concerns over the strength of the labor market.
Meanwhile, a massive winter storm swept up the East Coast, leading to the closure of federal offices and public schools. The storm has also caused numerous power outages, traffic accidents and flight cancellations. However, the cold weather was expected to support energy prices and increase demand for heating oil.
Please note that the price of light crude was also supported by supply disruptions in Libya after the El Sahara pipeline connecting southern Libyan oil fields to the port of Zawiya was shut down by protesters.
Having discussed the above, let’s move on to the technical changes in the crude oil market (charts courtesy of http://stockcharts.com.)
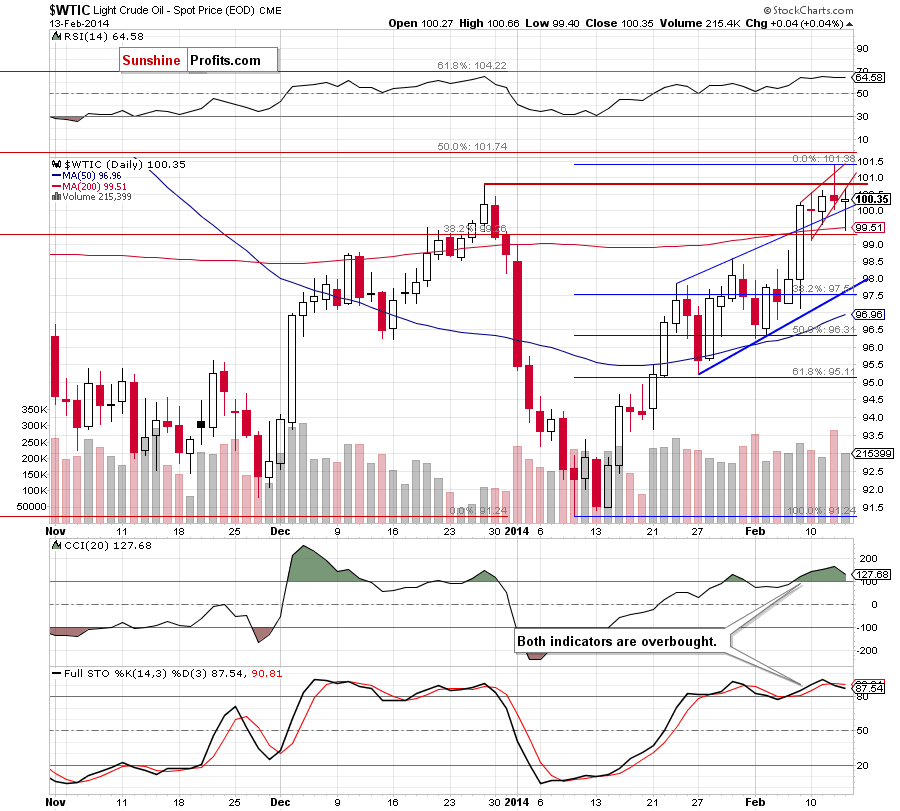
Looking at the above chart, we see that crude oil opened the day below the lower border of a small rising wedge (marked in red on the above chart), which triggered further deterioration and resulted in a drop below the upper border of the rising trend channel. With this downswing, light crude reached the 200-day moving average and almost touched the previously-broken 38.2% Fibonacci retracement level. As you see on the daily chart, this support zone encouraged buyers to act and crude oil rebounded. Despite this growth, light crude still remains below the lower border of a small rising wedge, which is not a positive sign – especially when we factor in the position of the indicators (they both are overbought and the Stochastic Oscillator generated a sell signal). So far, crude oil remains above the upper border of the rising trend channel, which supports buyers. However, if this important line is broken and the price drops below the 200-day moving average, we will likely see a downward move to the lower border of the rising trend channel (currently around $97.70). Please note that this area is supported by the 38.2% Fibonacci retracement level based on the recent rally.
Having discussed the current situation in light crude, let’s take a look at WTI Crude Oil (the CFD).
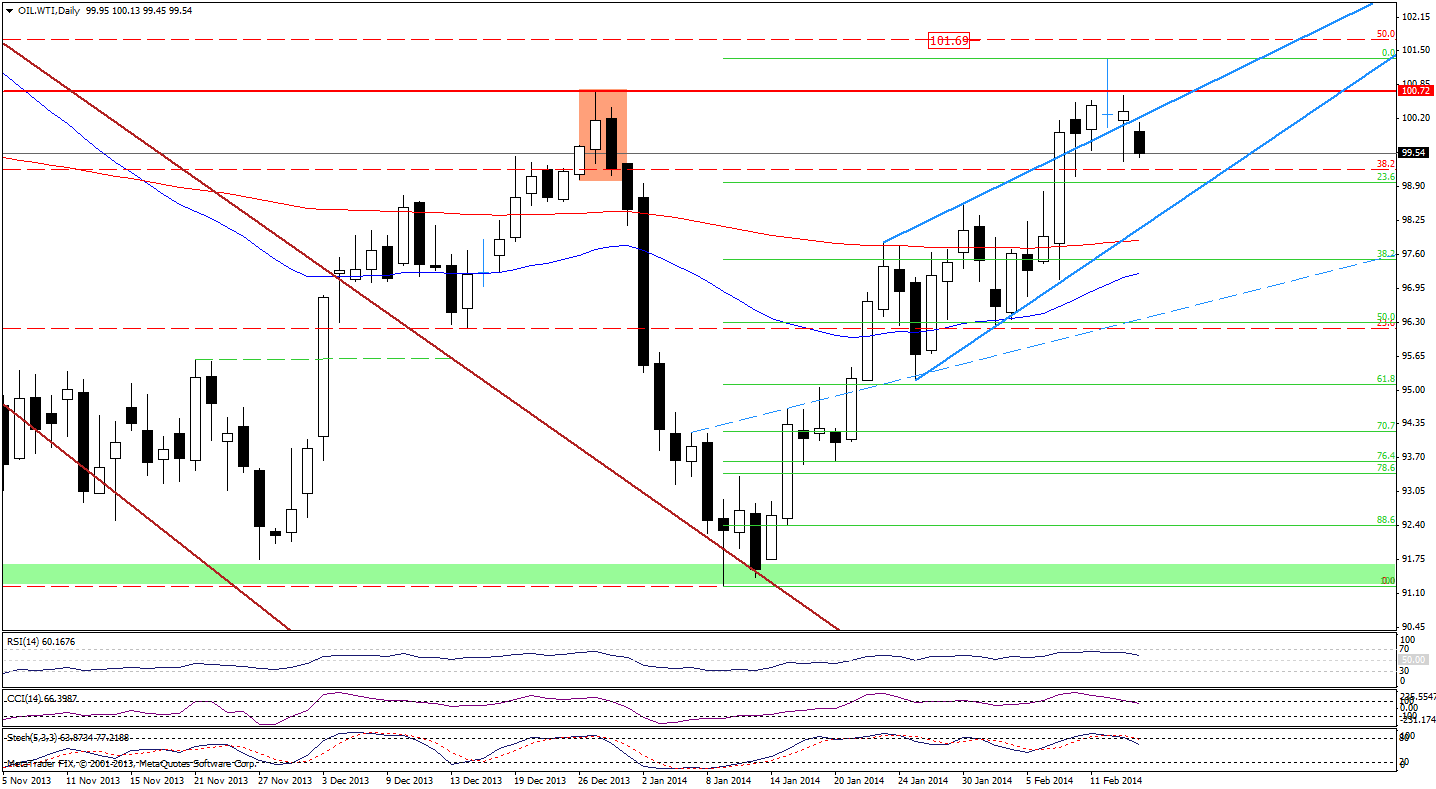
On the above chart, we see that although the CFD declined below the upper border of the rising trend channel (which actually looks like a rising wedge from this perspective), oil bulls didn’t give up and manage to push the price above this important line yesterday. Despite this growth, WTI Crude Oil climbed only to the previous high, which was not a positive sign. Earlier today, the CFD drops below the upper border of the rising trend channel (rising wedge) once again. Therefore, if WTI Crude Oil closes the day below this line, it will be a strong bearish signal that will likely trigger further deterioration. If this is the case, the downside target for sellers will be the lower border of the rising trend channel (rising wedge), slightly above the 200-day moving average. Please note that sell signals generated by the Stochastic Oscillator and CCI remain in place supporting oil bears.
Summing up, although crude oil rebounded after a drop below the upper border of the rising trend channel, it still remains below the lower line of a small rising wedge. Taking this fact into account, and combining with the position of the indicators and the current situation in the CFD (an unconfirmed breakdown below the upper border of the rising trend channel/rising wedge and sell signals generated by the indicators), it seems that we will likely see another attempt to invalidate the breakout above the upper border of the rising trend channel in the coming day (or days). In this case, if the important support line is broken and the price drops below the 200-day moving average, we will likely see a downward move to (at least) the lower border of the rising trend channel (currently around $97.70).
Very short-term outlook: mixed
Short-term outlook: bullish
MT outlook: bullish
LT outlook: mixed
Trading position (short-term): In our opinion, as long as there is no an invalidation of the breakout above the upper line of the rising trend channel, the situation will not be bearish enough to justify opening short positions. However, if crude oil declines below the 200-day moving average, we might consider opening short positions. We will keep you informed should anything change, or should we see a confirmation/invalidation of the above.
Thank you.
Nadia Simmons
Forex & Oil Trading Strategist
Forex Trading Alerts
Oil Investment Updates
Oil Trading Alerts

