
On Monday, crude oil gained 1.26% as stronger-than-expected manufacturing data across the globe bolstered hopes of increasing crude demand. This is light crude’s biggest one-day gain since Nov. 21. In this way, crude oil climbed to an intraday high of $94.08 and closed the day slightly below this level.
Oil prices began their climb after traders digested a reading from China's official Purchasing Managers' Index, which came in at 51.4 for November, a figure better than economists had expected and above the 50-point level, which indicates expansion. Please note that the PMI, which is a gauge of the country's manufacturing health, is important to oil investors because China has accounted for roughly 10% of oil demand in recent years, according to the International Energy Agency.
Additionally, a report from the Institute for Supply management showed that U.S. manufacturing activity unexpectedly rose to 57.3 last month, up from 56.4 in October. The reading was the highest for the U.S. since April 2011, which fueled optimism for more robust economic recovery.
Meanwhile, across the Atlantic, the euro zone's manufacturing PMI rose to a two-year high of 51.6 in November from October's 51.5 reading, beating estimates for an unchanged figure.
This bullish economic news eased some of the concerns over a glut of crude supplies (particularly in the U.S.) and helped to support the price, which bode well for light crude.
Once we know these major factors which had an impact on light crude, let’s move on to the technical changes in the crude oil market (charts courtesy of http://stockcharts.com).
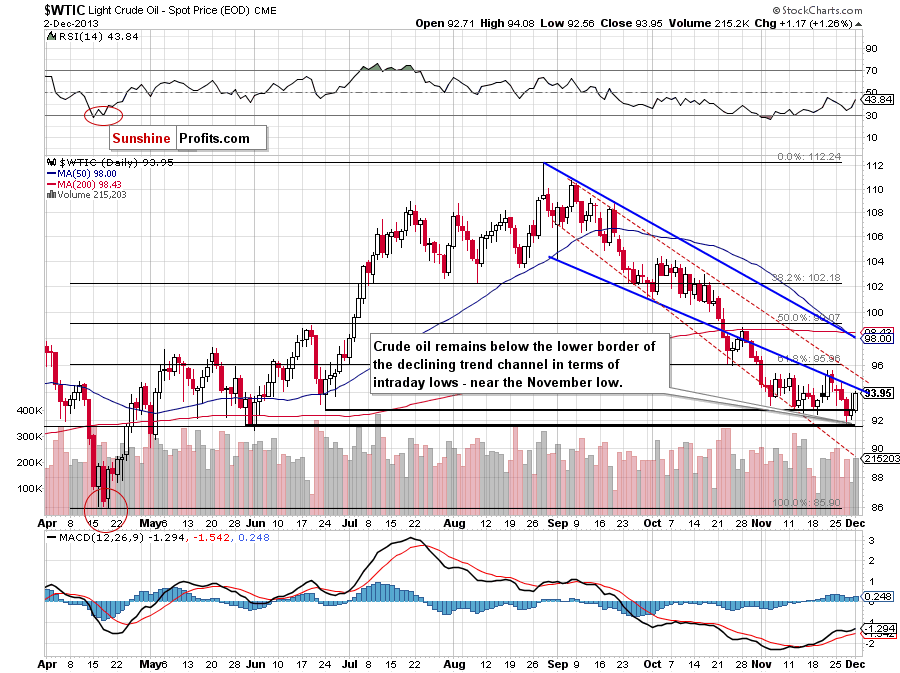
On the above chart, we see that crude oil continued its rally during Monday’s session and approached the lower border of the declining trend channel, which is a major short-term resistance level. In our yesterday’s Oil Trading Alert, we wrote that as long as this strong resistance is in play, further growth is limited and a bigger pullback is unlikely.
Nevertheless, at the end of last month, crude oil broke above this resistance level and came back in the range of the declining trend channel in terms of intraday lows. Back then, the proximity to the upper border of the declining trend channel in terms of daily closing prices (marked with the red dashed line) encouraged oil bears to act and light crude invalidated the breakout, which resulted in a new monthly low. Taking this fact into account, it seems that a bigger pullback is likely to be seen after a breakout above the Nov. 21 high, which is slightly above both resistance lines.
Please note that the nearest support is the November low and the 78.6% Fibonacci retracement level (at $91.54) based on the entire April-August rally, which reinforces this area and serves as additional support.
Once we know the current situation in crude oil, let’s take a look at the NYSE Arca Oil Index (XOI) weekly chart.
Quoting our last Oil Trading Alert:
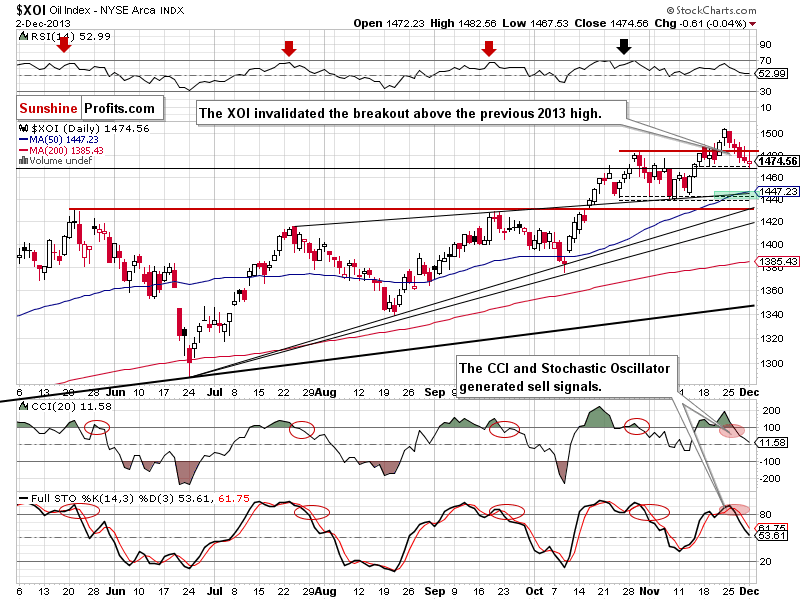
(…) the XOI extended its decline on Friday and almost reached the bottom of the recent corrective move. In this way, the oil stock index corrected 50% of its November rally and, from this point of view, the correction is still shallow. Taking this fact into account and combining it with the proximity to the support level, we may see a pullback in the coming days.
Looking at the above chart, we saw such price action during yesterday’s session. After an intraday breakdown below the bottom of the previous correction the XOI rebounded and reached the level of the previous 2013 high. However, this resistance level stopped further growth and the oil stock index declined to 1,474.
From this point of view, it’s hard to say that the worst is already behind oil stocks. It seems that as long as the XOI remains below this resistance a pullback to the annual high is unlikely.
Please note that sell signals generated by the indicators remain in place and encourage sellers to act. If the XOI confirms a breakdown below 1,470, we will likely see further deterioration. In this case, the downside target will be around 1,445 (marked with the green rectangle) where the upper line of the rising wedge intersects with the 50-day moving average and the bottom of the correction that we saw at the beginning of November.
Summing up, the very short-term situation has improved as crude oil drifted away from the November low and approached to the lower border of the declining trend channel in terms of intraday lows. Additionally, it also came back above the previously-broken medium-term support line, however it’s too early to say that the breakdown is invalidated (we’ll have to wait until the end of the week). Nevertheless, this strong short-term resistance may encourage oil bears to correct yesterday's gains – similarly to what we saw in the previous month.
Very short-term outlook: mixed
Short-term outlook: bearish
MT outlook: bearish
LT outlook: unclear
Trading position (short-term): Taking into account the long-term support lines and the short-term resistance, we do not suggest opening any positions at the moment. We will keep you informed should anything change, or should we see a confirmation/invalidation of the above.
Thank you.
Nadia Simmons
Sunshine Profits' Crude Oil Expert
Oil Investment Updates
Oil Trading Alerts

