
On Wednesday, crude oil lost 1.49% as the EIA data showed that U.S. gasoline and distillates stockpiles rose more than expected last week. Thanks to this news, light crude extended its decline and hit a fresh monthly low of $92.26 per barrel.
Yesterday, the U.S. Energy Information Administration said in its weekly report that U.S. crude oil inventories fell by 2.68 million barrels in the week ended Jan. 3, beating expectations for a decline of 849,000 barrels. Despite this positive news, total motor gasoline inventories increased by 6.24 million barrels (significantly higher than expectations for a gain of 2.28 million barrels), while inventories of distillates, which include diesel fuel and heating oil, rose by 5.83 million barrels compared to market calls for a gain of 1.90 million.
Similarly to what we saw in the previous week, such hikes in refined oil products pushed the price of light crude and resulted in a fresh monthly low.
Having discussed the above, let’s move on to the technical changes in the crude oil market (charts courtesy of http://stockcharts.com).
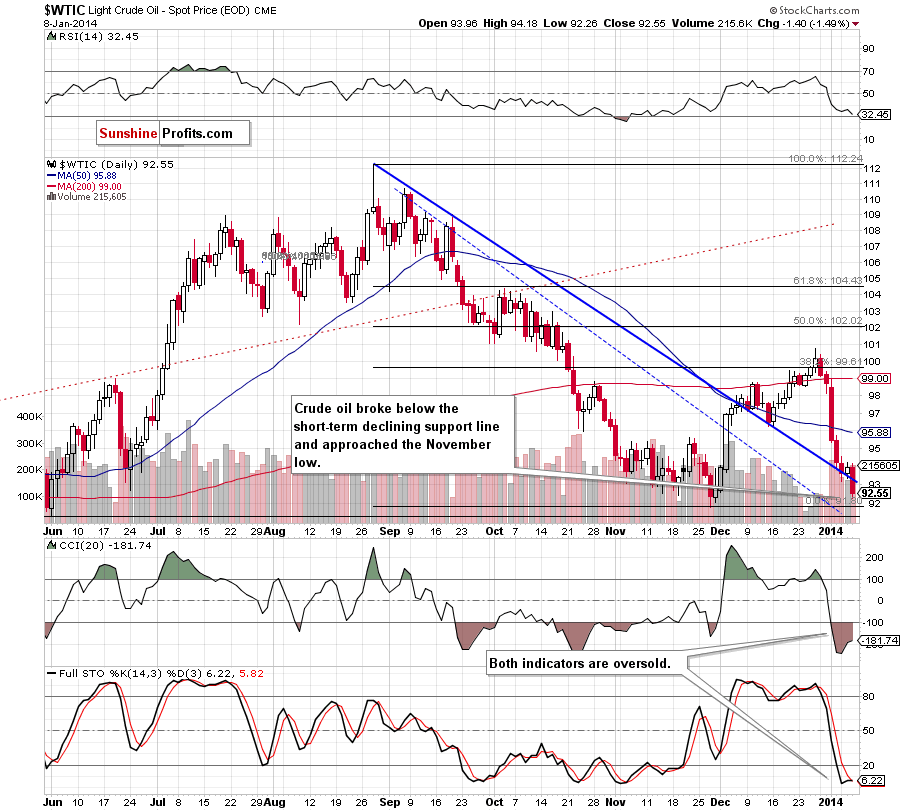
On the above chart, we see that the situation has deteriorated as crude oil declined (and closed the day) below the short-term declining support line. With this downswing light crude approached the November low and dropped to the 200-week moving average ($92.52).
Quoting our Oil Trading Alert from Tuesday:
(...) in November 2013 (...) it was the 200-day moving average that stopped the decline and triggered a reversal. Perhaps we will see similar action in the following days. This moving average is about $1 below the current price, so the downside seems very limited, and given the preceding action, in the previous similar case, the upside can be quite significant, even on a short-term basis.
Taking the above into account and combining with the position of the indicators (the CCI and Stochastic Oscillator are oversold and there is a positive divergence between the CCI and the price of light crude), we may see an upward correction in the coming day (or days).
Having discussed the current situation in light crude, let’s take a look at WTI Crude Oil (the CFD).
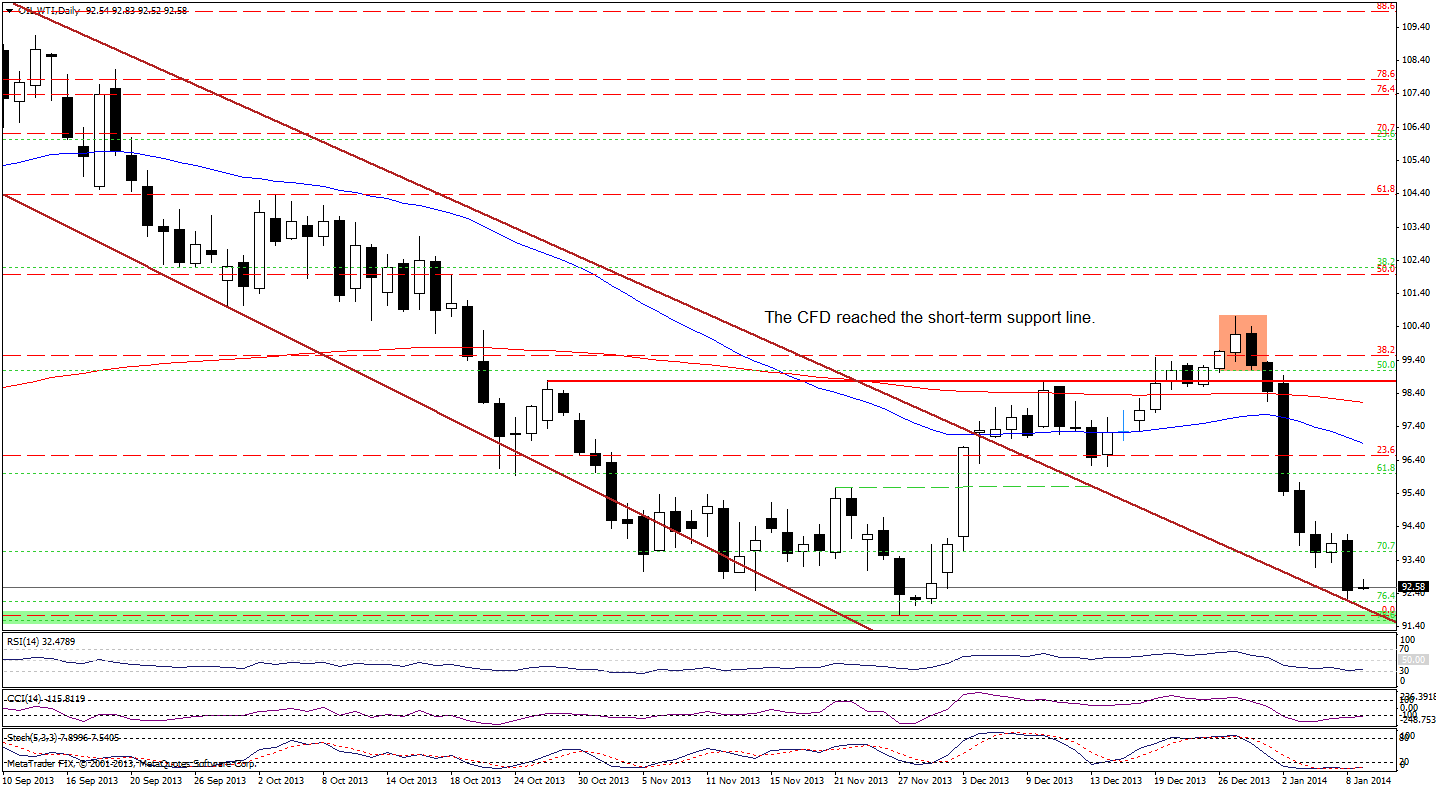
In our last Oil Trading Alert, we wrote the following:
(…) the CFD remains in a consolidation. (…) If oil bulls push WTI Crude Oil above Monday’s high, we will likely see an upswing to around $96. On the other hand, if they fail, we could see further deterioration and the downside target will be around the November low.
On the above chart, we see that the CFD extended its decline yesterday. Oil bulls didn’t manage to hold the lower border of the consolidation, which resulted in a sharp decline in the following hours. With this downswing, WTI Crude Oil declined to the previously-broken short-term declining support line based on the August and September highs and (just like crude oil) approached the November low.
Looking at the position of the indicators, we see that the RSI still remains slightly above the level of 30. When we take a closer look, we notice a positive divergence between the CCI, Stochastic Oscillator and the CFD, which is a positive sign. Nevertheless, although both indicators are oversold, they haven’t generated buy signals yet.
The combination of the proximity to the November low, short-term declining support line and the position of the indicators may encourage oil bulls to act and trigger an upside correction.
Once we know the above, let’s take a look at the NYSE Arca Oil Index (XOI) chart.
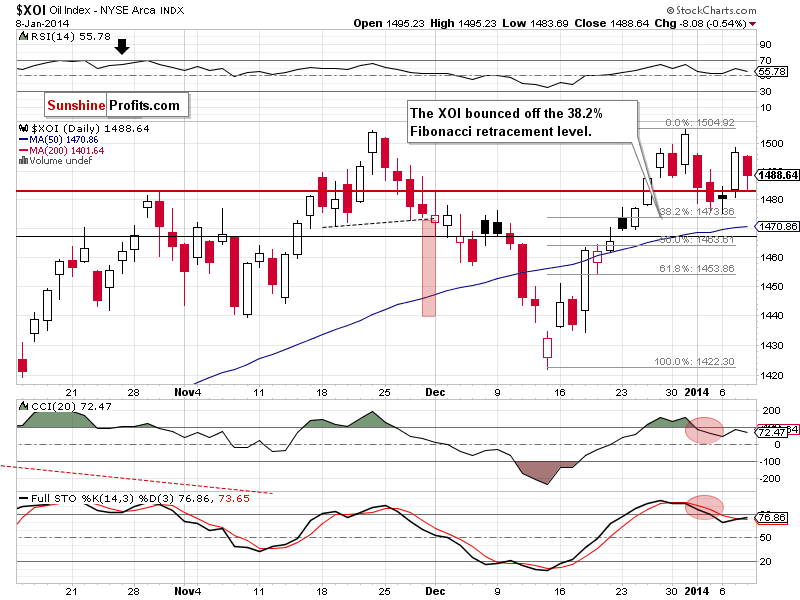
On the above chart, we see that the oil stock index gave up the gains and dropped below 1,490 once again. Although the proximity to the psychological barrier of 1,500 encouraged sellers to push the sell button, the XOI didn’t invalidate the bullish candlestick pattern (a morning star), which still supports buyers. If they manage to push the oil stock index higher, we will likely see another attempt to break above the level of 1,500. On the other hand, if the XOI extends its decline, the first downside target will be Monday’s low and the 38.2% Fibonacci retracement level.
Summing up, crude oil declined once again and dropped below the short-term declining support line, which is a bearish signal. As mentioned earlier, with this drop light crude reached the 200-week moving average, which successfully stopped further deterioration in November. Taking this fact into account and combining it with the proximity to the November low we may see an upward correction in the coming day (or days). However, if the buyers fail and the price drops below the blue lines marked on the weekly chart, we will likely see further deterioration.
Very short-term outlook: bearish
Short-term outlook: bearish
MT outlook: mixed
LT outlook: mixed
Trading position (short-term): We do not suggest opening any positions at the moment. We will keep you informed should anything change, or should we see a confirmation/invalidation of the above.
Thank you.
Nadia Simmons
Forex & Oil Trading Strategist
Oil Investment Updates
Oil Trading Alerts

