
On Monday, crude oil gained 0.71% after talks between Iran and Western leaders over Iran's nuclear program failed. Light crude climbed to its daily high of $95.38 and closed the day above $95 for the first time since the end of October.
Iran and six world powers failed to reach a deal on Tehran's nuclear program during their meeting in Geneva, tempering expectations of an end to the decade-long stalemate. As we wrote in the previous month, according to the Energy Information Administration Iran's average oil and condensate exports fell to 1.53 million barrels a day in 2012 from 2.51 million barrels a day in 2011, due mainly to sanctions. Without a doubt, they have helped support prices by removing more than 1 million barrels per day (bpd) of oil from world markets. They have also hobbled Iran's ability to keep its oil and gas infrastructure in good repair and start up new projects, making it hard to meet local gas demand.
Although investors worry that a deal for Iran to curb its nuclear activities could lead to the return of more than 1 million barrels of oil to the global market and push the price lower, it seems that last weekend’s failure removed any possibility of a let-up in sanctions anytime soon. While some diplomats believe a deal is still possible, U.S. lawmakers are trying to tighten sanctions on Iran which could push oil prices even higher. Please note that negotiations will resume on a lower-level on Nov. 20.
Having discussed the above, let’s move on to the technical changes in the crude oil market (charts courtesy of http://stockcharts.com).
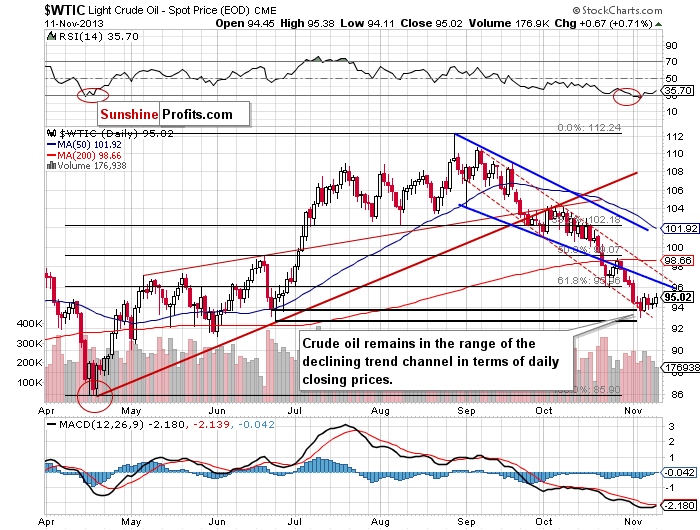
Yesterday, after the market’s open crude oil hit its daily low of $94.11. In spite of this little drop, in the following hours light crude not only erased earlier losses, but also climbed to slightly below Wednesday’s top and closed the day above $95 for the first time since the end of October. Despite this increase, crude oil still remains in the range of the consolidation.
Quoting our previous Oil Trading Alert:
(…) Please note that the recent days have formed a consolidation on the above chart. Therefore, if the oil bulls push crude oil above Wednesday’s top we will likely see an upward move to the lower border of the declining trend channel (in terms of intraday lows – marked with bold blue line) – currently around $96.50. However, if they fail, oil bears will likely make oil test the strength of the November low, which currently intersects with the lower border the declining trend channel (in terms of daily closing process – marked with thin red line).
(…) crude oil still remains in the range of the declining trend channel in terms of daily closing prices (marked with the red dashed line). (…) the lower border of this channel (currently around $93) and the bottom of the corrective move that we saw in June (in terms of daily closing prices) still serve as support.
Once we know the current situation in crude oil, let’s move on to the XOI daily chart.
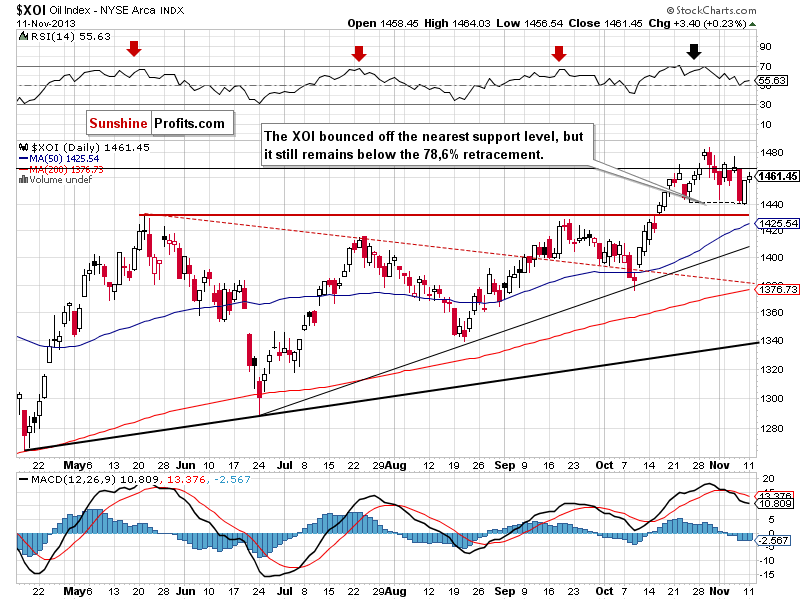
Looking at the above chart, we see that the oil stocks index continued its rally on Monday. In spite of this growth, it didn’t move above the 78.6% retracement, which still serves as strong resistance. Therefore, it seems that as long as the XOI remains below this level, further increases are limited.
Please note that the MACD generated a sell signal for the first time since the beginning of October. We also saw similar situations at the end of May and at the beginning of August. In all previous cases the result was further deterioration. If history repeats itself once again, we will likely see another corrective move in the coming days.
The nearest support level is the bottom of the recent corrective move at 1,439. The nearest resistance level is the previously-broken the 78.6% retracement and the next one is the 2013 high.
Summing up, the situation hasn’t changed much and crude oil remains in the declining trend channel in terms of daily closing prices. The lower border of this channel and the bottom of the corrective move that we saw in June (in terms of daily closing prices) still serve as support. As we wrote in our previous Oil Trading Alert, it’s too early to assume that the final bottom of the recent corrective move is already in.
Very short-term outlook: bearish
Short-term outlook: bearish
MT outlook: bearish
LT outlook: unclear
Trading position (short-term): Taking into account the medium- and short-term picture, we do not suggest opening any positions yet.
Thank you.
Nadia Simmons
Sunshine Profits' Crude Oil Expert
Oil Investment Updates
Oil Trading Alerts

