
Trading position (short-term; our opinion): No positions are justified from the risk/reward perspective.
On Wednesday, crude oil gained 0.54% as a better-than-expected report from the EIA supported the price. As a result, light crude bounced off the recent multi-year low and hit an intraday high of $58.98. Will we see further improvement in the coming days?
Yesterday, the U.S. Energy Information Administration reported that U.S. crude oil inventories fell by 0.847 million barrels in the week ending Dec, 12, while distillate stockpiles dropped by 0.207 million barrels. These bullish numbers supported the price of the commodity and triggered a corrective upswing. How high could crude oil go in the near future? (charts courtesy of http://stockcharts.com).
On Tuesday, we wrote the following:
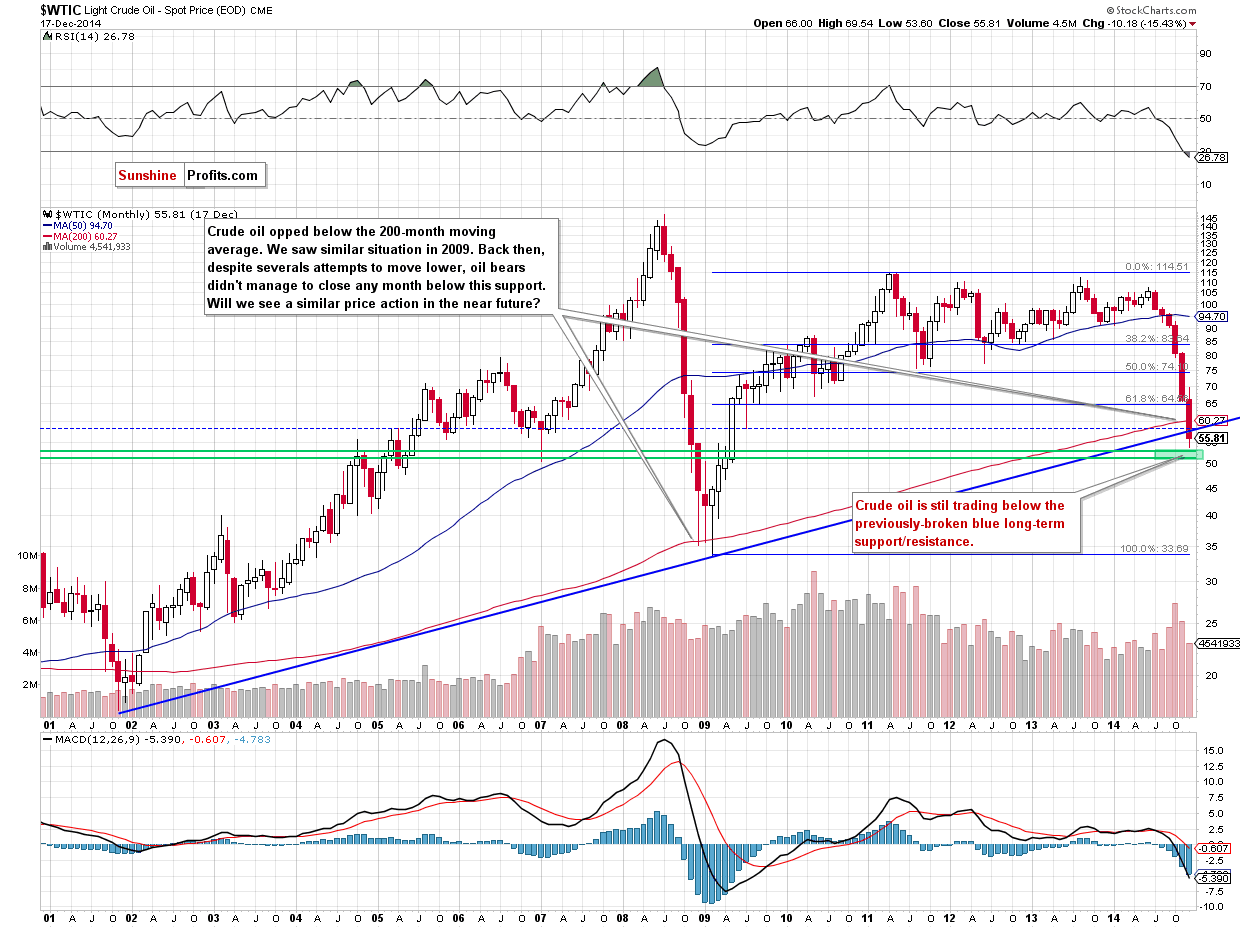
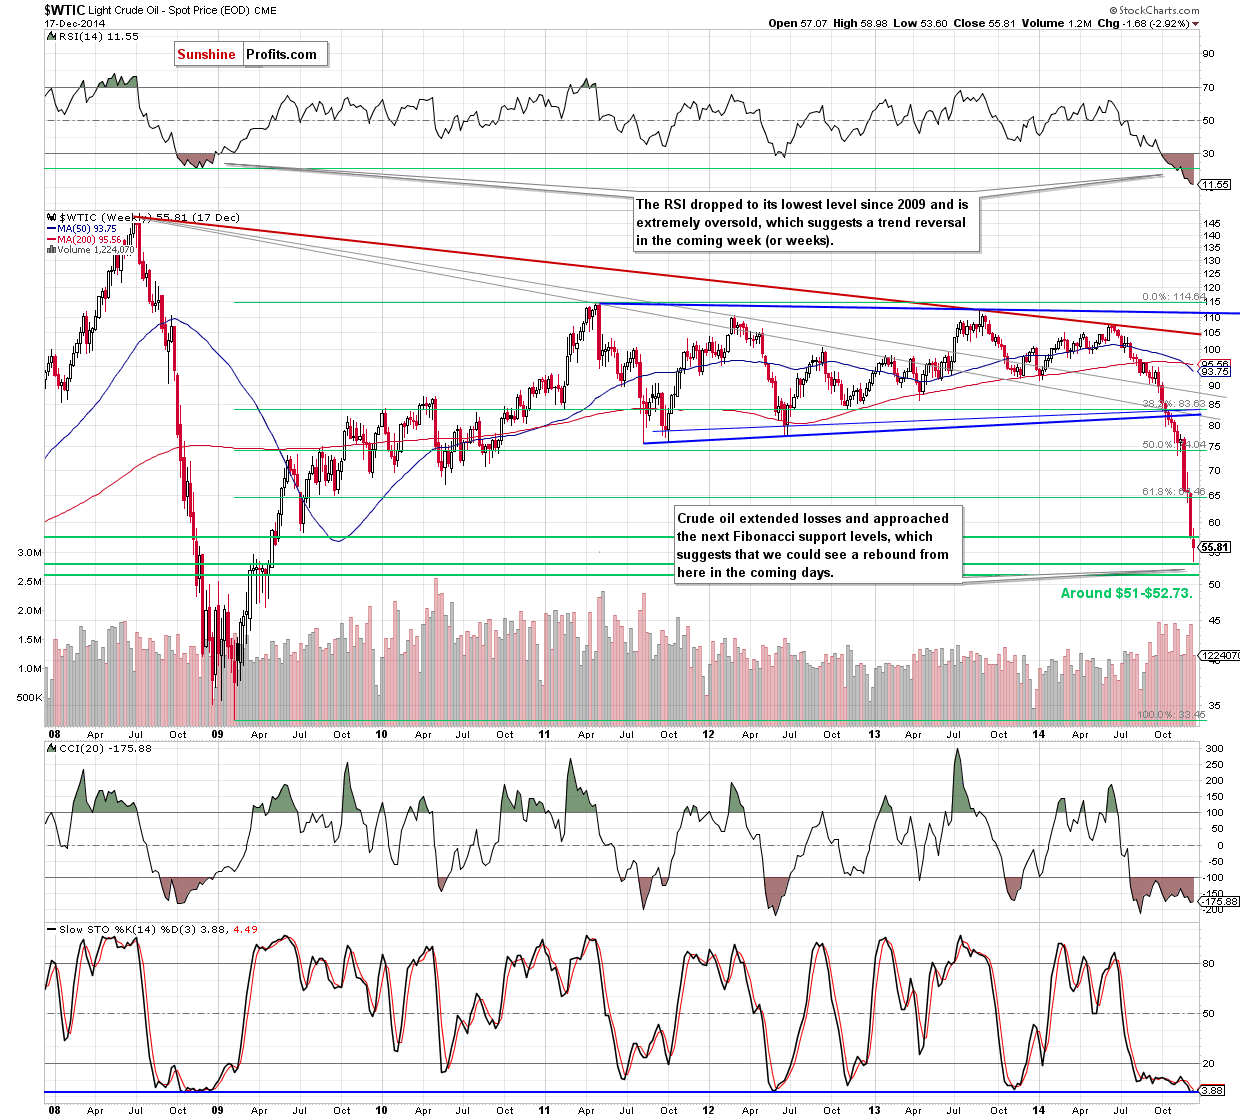
The first thing that catches the eye on the above charts is a breakdown below the long-term blue support line (based on the 2002 and 2009 lows and marked on the monthly chart) and the 70.7% Fibonacci retracement based on the entire 2009-2014 rally (marked with green on the weekly chart), which suggests further deterioration in the coming day (or days). If this is the case, the commodity could drop to around $51-$52.73, where the 76.4% and 78.6% Fibonacci retracement levels are.
Yesterday, we added:
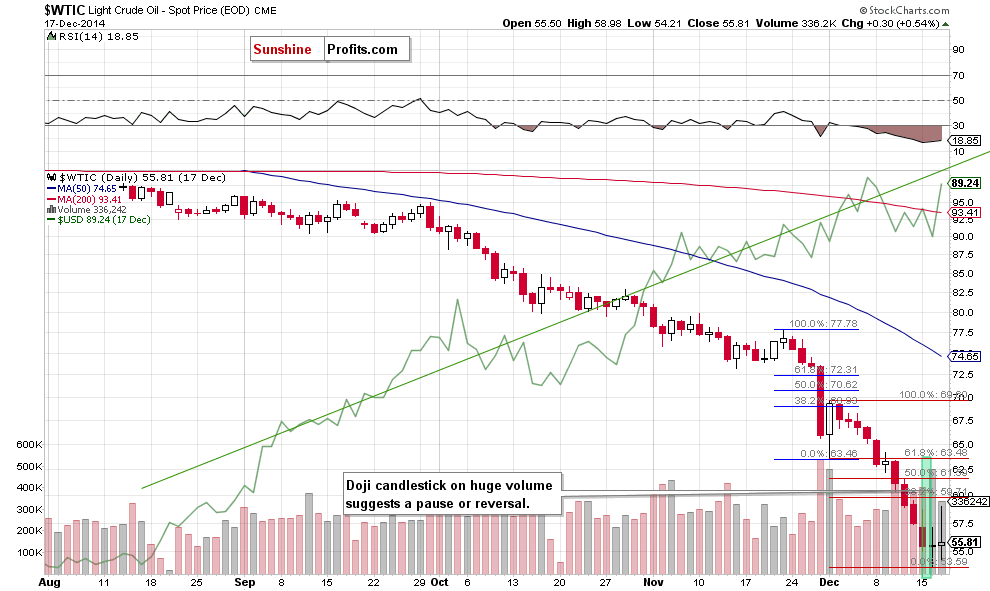
(…) why can we expect a pause here? Because on a short-term basis we saw a daily reversal (doji candlestick) on significant volume.
Looking at the above charts, we see that the combination of the proximity to the support zone (created by the 76.4% and 78.6% Fibonacci retracement levels) and the above-mentioned doji candlestick triggered a corrective upswing as we expected. With this move, the commodity bounced off the recent multi-year low and approached the 38.2% Fibonacci retracement (based on the entire Dec decline). What’s next? As you see on the daily chart, the proximity to the first Fibonacci resistance triggered a pullback yesterday, which suggests that as long as we do not see a successful breakout above this level, further improvement is questionable and a test of the recent lows should not surprise us. The reason? When we take a closer look at the daily chart, we see that there was a similar price action at the beginning of the month. Back then, although crude oil corrected over 38.2% of earlier downward move, oil bulls didn’t manage to push the commodity higher, which translated to a fresh 2014 low. Therefore, we think that a trend reversal (and an upward move to the initial upside target around $70) will be likely only if we see an upswing above $59.50, which won’t be followed by a fresh low. Until this time, another pullback is likely.
Summing up, although crude oil moved higher, we think that as long as we do not see a successful breakout above the 38.2% Fibonacci retracement (based on the entire Dec decline), further improvement is questionable and a test of the recent lows should not surprise us. On the other hand, the space for declines seems limited, therefore, opening any positions at these levels is not justified from the risk/reward perspective.
Very short-term outlook: mixed
Short-term outlook: mixed
MT outlook: mixed
LT outlook: bullish
Trading position (short-term; our opinion): No positions are justified from the risk/reward perspective at the moment, but we will keep you informed should anything change.
Thank you.
Nadia Simmons
Forex & Oil Trading Strategist
Przemyslaw Radomski, CFA
Founder, Editor-in-chief
Gold & Silver Trading Alerts
Forex Trading Alerts
Oil Investment Updates
Oil Trading Alerts

