
Trading position (short-term; our opinion): In our opinion no positions are justified from the risk/reward perspective.
On Wednesday, crude oil gained 1.94% after the EIA weekly report showed that oil supplies in the U.S. fell more than expected. Thanks to this data, light crude invalidated the breakdown below an important support zone. As is well known, such price action is a strong bullish signal that usually trigger further improvement, but can we trust it this time?
Yesterday, the U.S. Energy Information Administration showed in its weekly report that U.S. crude oil inventories declined by 4.5 million barrels in the week ended August 15, compared to expectations for a decline of 1.2 million barrels (please note that oil stockpiles are at their lowest since February, after hitting record highs in April). Additionally, refining capacity utilization rose by 1.8 percentage points to 93.4% of capacity, while analysts had expected the operating rate to fall by 0.3 percentage point in the week. Thanks to these bullish numbers, light crude rebounded and came back above $96 per barrel. Will we see a continuation of the rally in the coming days? (charts courtesy of http://stockcharts.com).
Yesterday, we wrote the following:
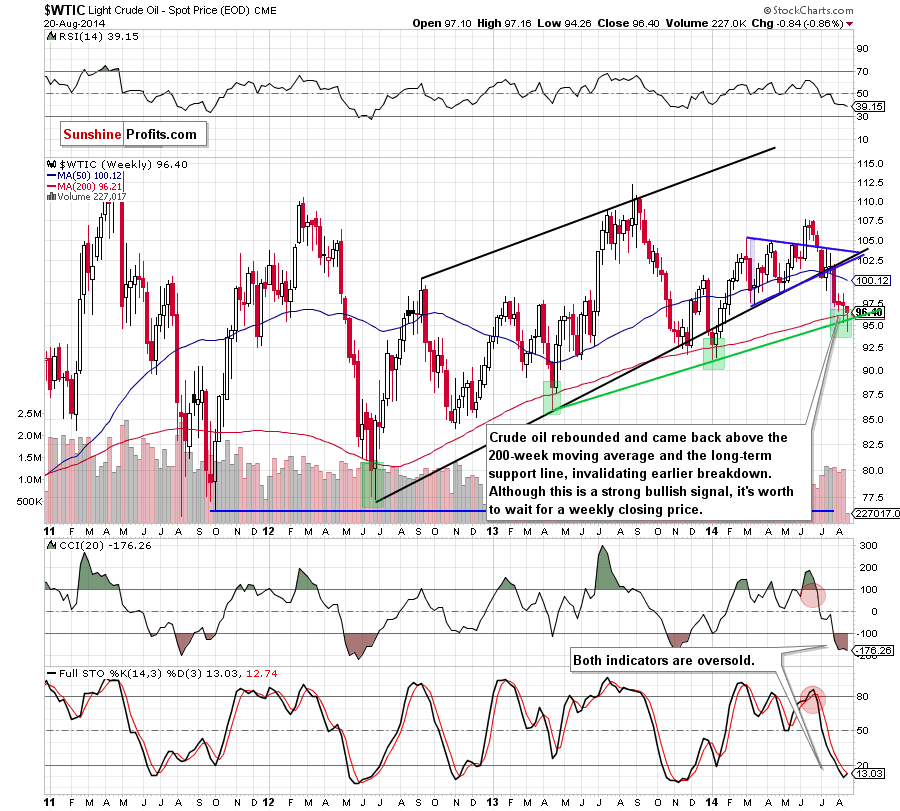
(…) crude oil declined below its major support levels – the 200-week moving average and the rising, long-term support line. Although this is a strong bearish signal, the week is not over yet. This means that we may see a rebound and invalidation of the breakdown (similarly to what we saw in June 2012) – especially when we take into account the fact that the size of the current correction corresponds to the height of the blue triangle, which could reduce the selling pressure and trigger an upswing in the near future.
Looking at the above chart, we see that crude oil rebounded and came back above the previously-broken major support levels. As we mentioned earlier, an invalidation of the breakdown is a strong bullish signal that usually trigger further improvement. However, taking into account the volatility that we have seen in the recent days, we think that it’s worth to wait for a weekly closing price before we estimate whether the situation has improved or not. Please note that the current position of the indicators suggests that a pause or a trend reversal is just around the corner. Nevertheless, as long as there are no buy signals, another attempt to test the strength of the support area can’t be ruled out.
Can we infer something more from the daily chart? Let’s check.
Yesterday, we focused on positive factors, which made the situation less bearish. As a reminder:
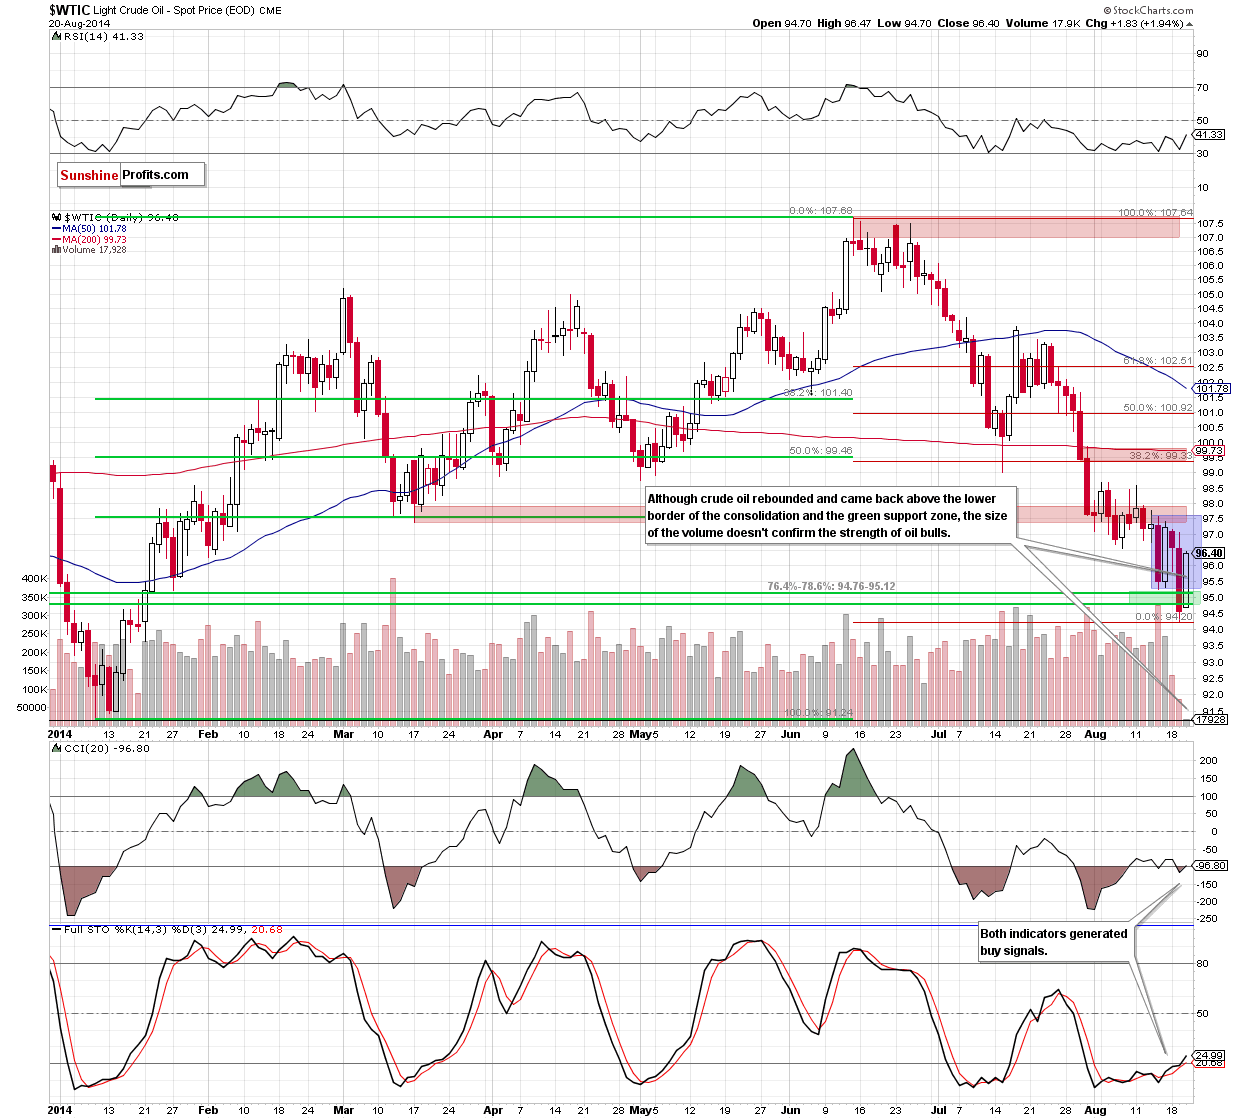
(…) there are clearly visible positive divergences between all three indicators and the price of light crude. (…) size of the volume that accompanied the decline doesn’t confirm the strength of oil bears (…) This tells us that the selling pressure waned and suggests that we may see a reversal in the coming day (or days). Finally, with yesterday’s downswing crude oil approached the bottom of the correction that we saw in January, which serves as support and could encourage oil bulls to act.
From this perspective, we see that the combination of these technical factors actually encouraged oil bulls to act and resulted in an invalidation of the breakdown below the green support zone. As we have pointed out before, this is a strong positive signal, which should trigger further rally. But is the situation as bullish as it looks at the first sight? Not really. The main reason, which makes us skeptical is the size of the volume. As you can see on the above chart, it was even smaller than a day before, which suggests that yesterday’s upswing could not be an important reversal, but just a one-day rally (we saw a similar situation on Friday). Therefore, we think that it’s worth to wait for a confirmation/invalidation of the above before making investment decisions. Nevertheless, we should keep in mind that the CCI and Stochastic Oscillator generated buy signals, which is another positive sign.
Summing up, the highlight of yesterday’s session was an invalidation of the breakdown below the 200-week moving average, the rising, long-term support line and the green support zone marked on the daily chart. Although is a very strong bullish signal, which should trigger further improvement, the size of the volume that accompanied the rally was tiny, so we don't think we should take this strength as an important reversal. Taking all the above into account, we still believe that staying on the sidelines waiting for more valuable clues about the direction of future moves is the best choice at the moment.
Very short-term outlook: mixed with bullish bias
Short-term outlook: mixed
MT outlook: mixed
LT outlook: bullish
Trading position (short-term): No positions are justified from the risk/reward perspective at the moment, but we will keep you informed should anything change.
Thank you.
Nadia Simmons
Forex & Oil Trading Strategist
Przemyslaw Radomski, CFA
Founder, Editor-in-chief
Gold & Silver Trading Alerts
Forex Trading Alerts
Oil Investment Updates
Oil Trading Alerts

