

Trading position (short-term; our opinion): No positions are justified from the risk/reward perspective.
Although crude oil moved higher after the market’s open, a bearish EIA report triggered a sharp decline, which resulted in a 2.39% loss. As a result, light crude declined under the barrier of $50 and reached the short-term support/resistance line. What does it mean for the commodity?
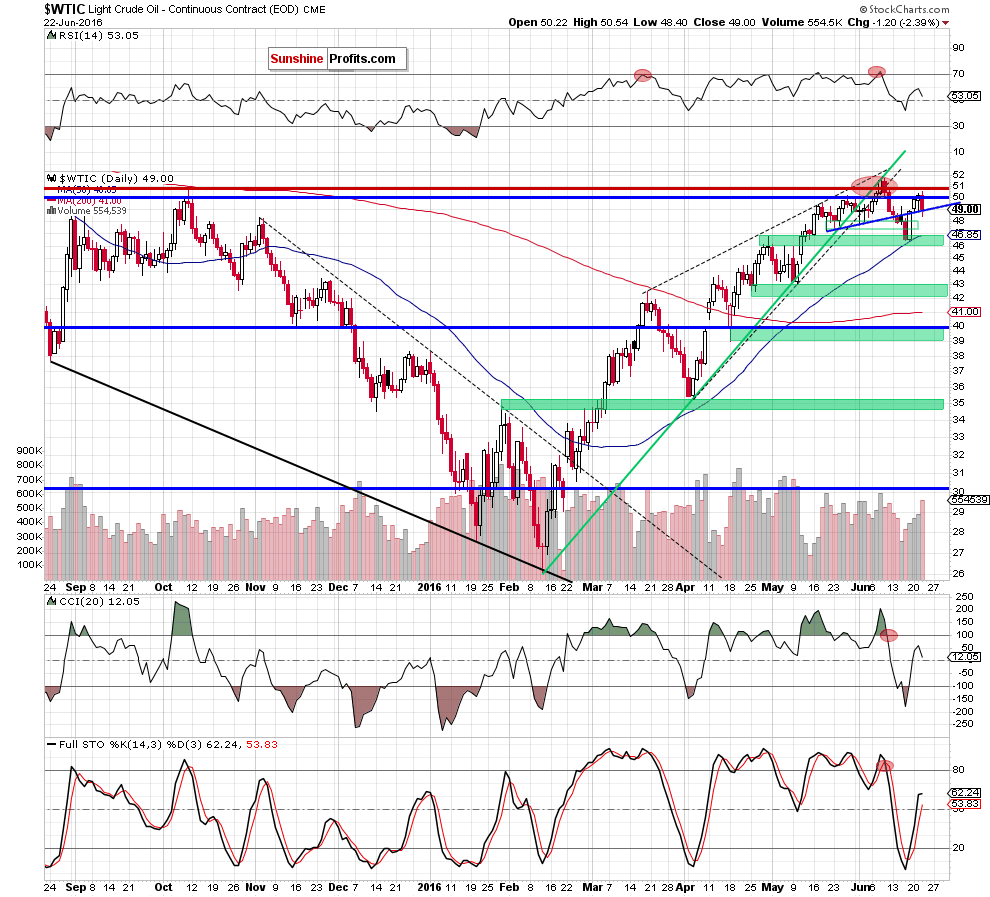
Yesterday, the U.S. Energy Information Administration reported that crude oil inventories dropped by 0.9 million barrels in the week ended June 17, missing analysts’ forecast and disappointing market participants (especially when we take into account the fact that the American Petroleum Institute late Tuesday reported a supply drop of 5.2 million barrels). Additionally, gasoline inventories increased by 0.6 million barrels, while distillate stockpiles rose by 0.2 million barrels. Thanks to these bearish numbers light crude moved sharply lower and declined under the barrier of $50 and reached the short-term support/resistance line. What’s next? Let’s examine the daily chart and find out what can w infer from it about future moves (charts courtesy of http://stockcharts.com).
Quoting our previous alert:
(…) the blue support line stopped further deterioration and encouraged oil bulls to act. As a result, the commodity reversed and rebounded sharply, invalidating earlier breakdown under the barrier of $50. This is a positive signal, which suggests further improvement – especially when we factor in buy signals generated by the indicators.
If this is the case and light crude moves higher from here, we may see an increase to around $50.42$50.54, where the nearest resistance zone (created by the 76.4% and 78.6% Fibonacci retracement levels based on the recent downward move) is. Nevertheless, taking into account today’s crude oil futures price action (they reversed and slipped temporary under the barrier of $50), we think that another re-test of the barrier of $50 (or even the blue support line) is likely.
Looking at the above chart from today’s point of view, we see that oil bulls pushed the commodity higher as we had expected, which resulted in an increase to the next resistance zone. As you see, this area was strong enough to stop further improvement and trigger a decline. With yesterday’s drop crude oil slipped under the level of $50 and reached our downside target - the blue support line.
What’s next? Taking into account the fact that this support stopped oil bears several times in the past, it seems to us that we’ll see similar price action and another rebound to the barrier of $50 later in the day. Therefore, in our opinion, as long as there won’t be a breakout above the resistance zone created by the 76.4% and 78.6% Fibonacci retracement levels based on the recent downward move or a daily closure under the blue support line another bigger upward or downward move is not likely to be seen and short-lived moves in both directions should not surprise.
Summing up, crude oil pulled back to the previously-broken blue support line once again, which suggests anther rebound and an increase to the barrier of $50 or even to the nest resistance zone. Therefore, taking into account the recent price action, the short-term picture of the commodity is to unclear to open any positions at the moment.
Very short-term outlook: mixed
Short-term outlook: mixed
MT outlook: mixed
LT outlook: mixed
Trading position (short-term; our opinion): No positions are justified from the risk/reward perspective. We will keep you – our subscribers – informed should anything change.
Thank you.
Nadia Simmons
Forex & Oil Trading Strategist
Przemyslaw Radomski, CFA
Founder, Editor-in-chief
Gold & Silver Trading Alerts
Forex Trading Alerts
Oil Investment Updates
Oil Trading Alerts

