
Trading position (short-term; our opinion): Speculative short positions in crude oil seem to be justified from the risk/reward perspective.
On Friday, crude oil gained 0.61% as better-than-expected data on U.S. home sales supported the price. Thanks to this news, light crude broke above the resistance line, reaching another. Will oil bulls be strong enough to break it too?
On Friday, the data showed that U.S. new home sales rose 6.4% to 433,000 units in April from 407,000 units in March, while analysts had expected new home sales to rise to 425,000 units last month. The data came in a day after a solid report on existing home sales. As a reminder, on Thursday, the National Association of Realtors reported that existing home sales in the U.S. increased 1.3% to a seasonally adjusted 4.65 million units in April from 4.59 million in March. These positive numbers fueled hopes that the U.S. housing sector is improving and the U.S. economy continues to recover and will demand more fuel and energy, which supported the price and pushed it to its highest level since five weeks.
Are there any technical factors on the horizon that could drive crude oil higher in the near future? Let’s check (charts courtesy of http://stockcharts.com).
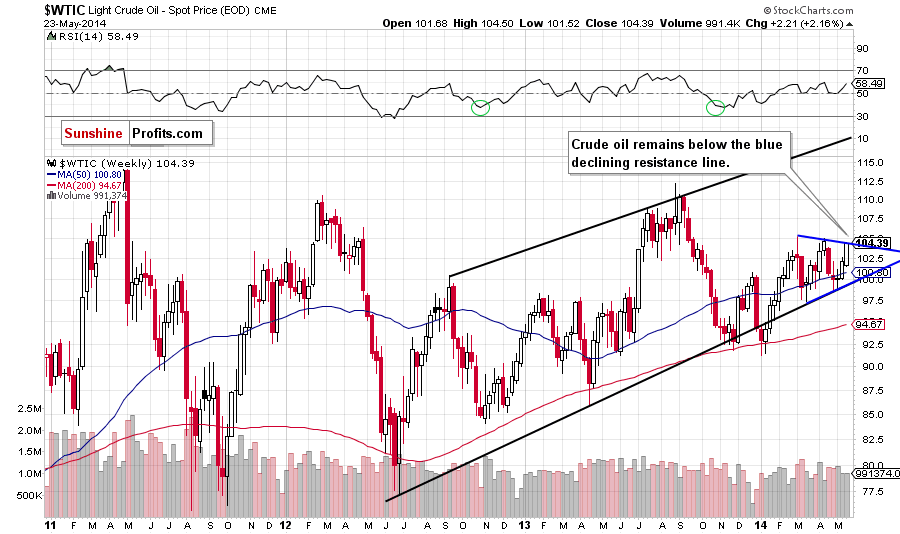
On the weekly chart, we see that although crude oil moved higher in the previous week, it still remains below the blue resistance line based on the recent highs, which is also the upper border of the triangle. If this line holds, we will likely see a pullback and the nearest support will be the 50-week moving average (currently at $100.80). However, if oil bulls do not give up and push the price above the resistance line, we will see further improvement and an increase to a fresh 2014 high.
Nevertheless, we should keep in mind that the last week’s increase materialized on relative small volume, which questions the strength of oil bulls. On top of that, the RSI approached the level of 60. We saw similar reading in April and also earlier in March. Back then, such readings preceded declines. Therefore, if history repeats itself once again, we may see a correction in the coming week (or weeks).
Having said that, let’s focus on the very short-term picture.
In our Friday's summary, we wrote the following:
(...) as long as light crude remains above the dashed rising line (which serves now as support), another test of the strength of the medium-term resistance can’t be ruled out.
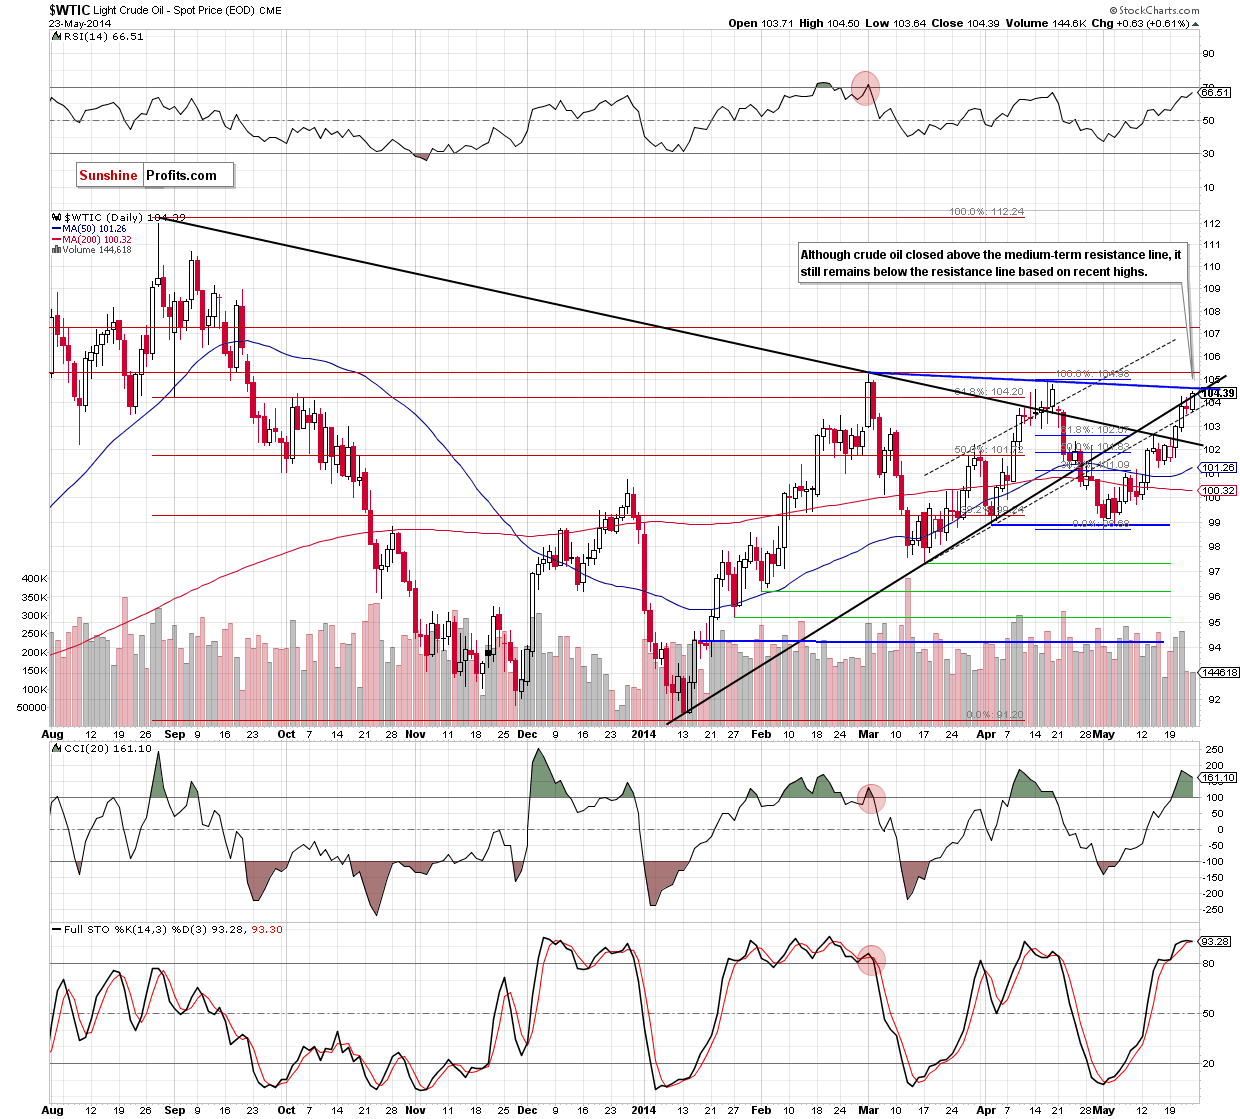
On the daily chart, we see that crude oil moved higher once again and broke above the medium-term resistance line, finishing the day slightly above it. Although this is a strong bullish signal, we noticed that the commodity still remains below the blue resistance line. As we mentioned earlier, this is also the upper border of the triangle, which suggests its importance as the breakout above it or pullback from here will likely trigger another sizable move. Taking this fact into account, let’s focus on other technical factors.
From the short-term perspective, we clearly see that the volume, which accompanied Friday’s upswing was small, which questions the strength of oil bulls. At this point it’s worth noting that we saw similar decrease in volume around the April high. Additionally, the position of the indicators, doesn't look bullish at the moment. There is a negative divergence between the CCI and crude oil, while the Stochastic Oscillator is overbought (well above the level of 80). On top of that, the RSI reached its highest level since April, approaching the barrier of 70, which suggests that a pause or a pullback is just around the corner.
What’s next? Taking all the above into account, it seems to us that the space for further growth is limited. Therefore, if crude oil reversed from here, invalidating the breakout, it will be a strong bearish signal that will trigger a correction in the coming days. What if light crude moves higher? In our opinion, the combination of the blue resistance line and the April high will be strong enough to stop further improvement.
Summing up, although crude oil moved higher once again, it seems to us that the combination of the blue resistance line and the April high will be strong enough to stop further improvement. Additionally, when we factor in the current position of the indicators and the size of the volume that we saw on Friday (and its similarity to mid-April), we think that the bearish scenario is more likely at the moment and we’ll see a correction in the coming days.
Very short-term outlook: bearish
Short-term outlook: bearish
MT outlook: mixed
LT outlook: mixed
Trading position (short-term): Short. Stop-loss order to $105.50. We will keep you informed should anything change, or should we see a confirmation/invalidation of the above.
Thank you.
Nadia Simmons
Forex & Oil Trading Strategist
Przemyslaw Radomski, CFA
Founder, Editor-in-chief
Gold & Silver Trading Alerts
Forex Trading Alerts
Oil Investment Updates
Oil Trading Alerts

