

Trading position (short-term; our opinion): No positions are justified from the risk/reward perspective.
On Monday, crude oil gained 4.92% as the Saudi Arabia announcement and a weaker greenback weighed on the price. As a result, light crude bounced off the support/resistance lines and reached its key resistance zone. Will we finally see a breakout in the coming days?
On Friday, the U.S. Bureau of Labor Statistics showed in its monthly jobs report that the economy added only 126,000 in March (this was less than half of February’s increase and the smallest gain since December 2013). Friday’s report also halted a streak of 12 consecutive months of job growth that exceeded 200,000 and fuelled doubts over the strength of the economic recovery. Thanks to these disappointing numbers the USD Index moved sharply lower, making crude oil more attractive for buyers holding other currencies.
On top of that, on Sunday, Saudi Arabia announced that the country is raising oil prices for May sales to Asia (it was the second price hike for Asian buyers), which improved oil investors’ sentiment and pushed the commodity to an intraday high of $52.24. Will we see a test of the Feb highs in the coming week? (charts courtesy of http://stockcharts.com).
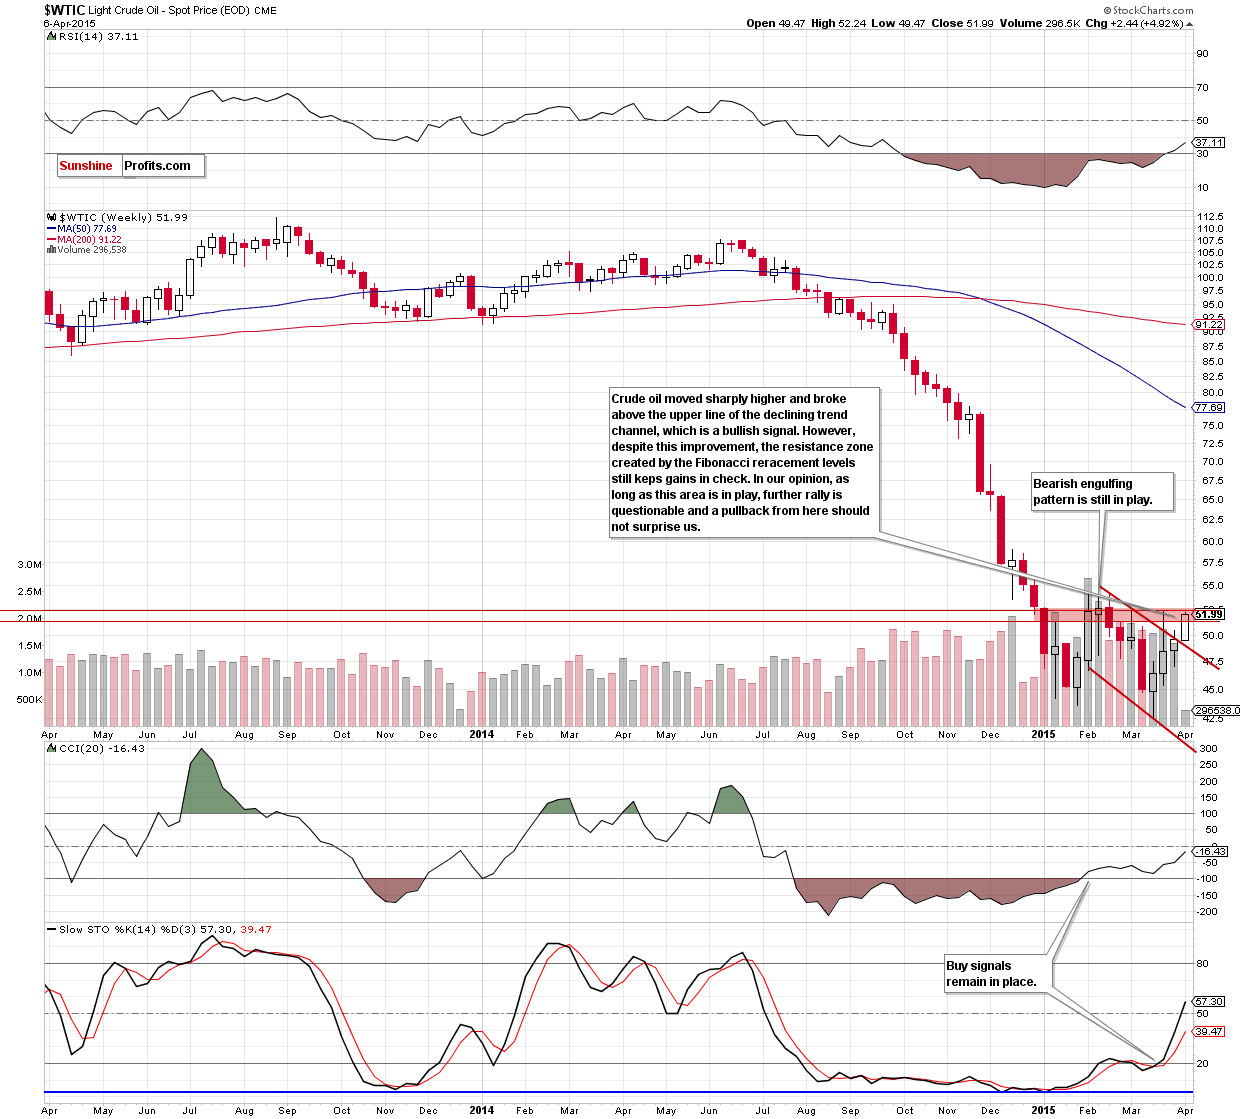
Looking at the above chart, we see that crude oil moved sharpy higher and broke above the upper line of the declining trend channel, which is a bullish signal that suggests further rally. Nevertheless, we should keep in mind that the resistance zone created by the 76.4% and 78.6% Fibonacci retracement levels is still in play. Therefore, in our opinion, as long as there is o breakout above this key resistance area further rally is questionable and a pullback from here in the coming week should not surprise us.
How did this rally affect the very short-trm picture? Let’s examine the daily chart and find out.
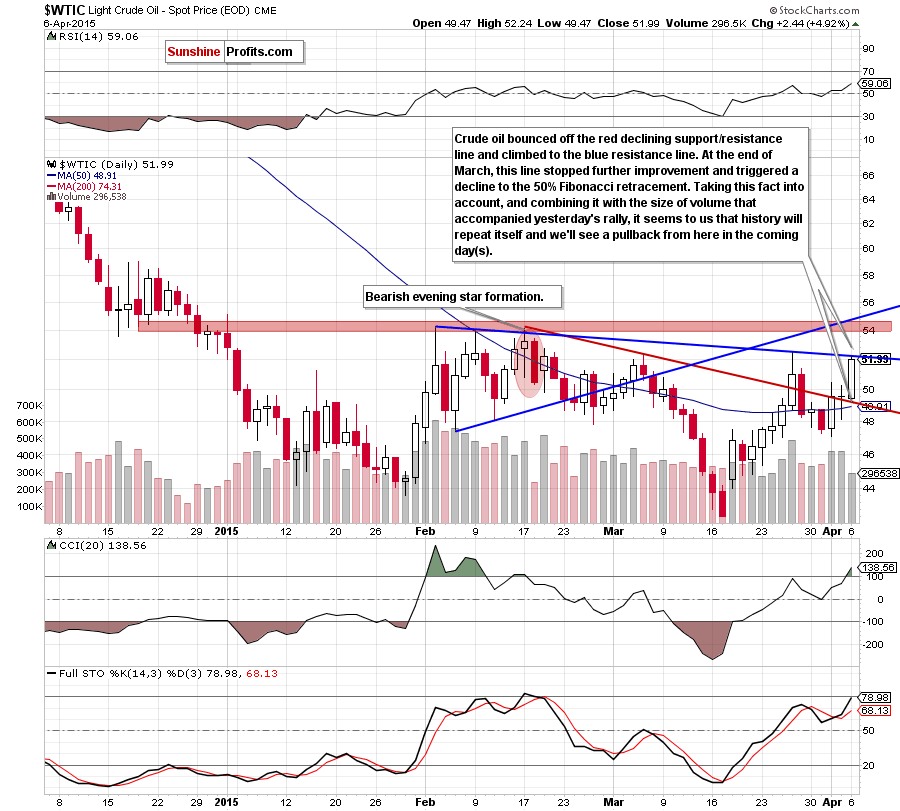
From today’s point of view, we see that crude oil bounced off the red declining support/resistance line and climbed to the blue resistance line. At this point it is worth noting that we saw similar price action at the end of March. Back then, this resistance line stopped further improvement and triggered a decline to the 50% Fibonacci retracement.
Taking this fact into account, and combining it with the size of volume that accompanied yesterday’s rally (it wasn’t huge compared to what we saw on Mar 26 or at the beginning of Feb) and the resistance zone marked on the weekly chart, it seems to us that history will repeat itself and we’ll see a pullback from here in the coming day(s).
Please note that the initial downside target for oil bears would be the above-mentioned red declining support/resistance line (currently around $49.20).
Summing up, although crude oil bounced off the red declining support/resistance line and broke above the upper border of the declining trend channel (marked on the weekly chart), the commodity still remains under the blue resistance line and the key resistance zone created by the Fibonacci retracements seen on the weekly chart. Therefore, we believe that as long as there is no breakout above this area further rally is not likely to be seen and another attempt to move lower is likely.
Very short-term outlook: mixed
Short-term outlook: mixed
MT outlook: mixed
LT outlook: bullish
Trading position (short-term; our opinion): No positions are justified from the risk/reward perspective at the moment, but we will keep you informed should anything change.
Thank you.
Nadia Simmons
Forex & Oil Trading Strategist
Przemyslaw Radomski, CFA
Founder, Editor-in-chief
Gold & Silver Trading Alerts
Forex Trading Alerts
Oil Investment Updates
Oil Trading Alerts

