
Trading position (short-term; our opinion): No positions are justified from the risk/reward perspective.
On Thursday, crude oil rebounded from a 2-week low as better-than-expected U.S. economic data, Ukraine tensions and potential Libyan supply disruptions weighted on the price. Despite this bullish combination, light crude didn’t shoot up sharply. Does it mean that benefiting from the fundamental factors waned? If so, what’s next?
Yesterday, the Commerce Department showed that U.S. orders for long lasting manufactured goods rose 2.6% in March, beating expectations for a 2% gain. Additionally, core durable goods orders (without volatile transportation items) increased 2% in the previous month, well above forecasts for a 0.6% gain. These better-than-expected numbers pointed to underlying strength in the economy and pushed the price of light crude higher.
Additionally, a mix of Ukraine tensions and potential Libyan supply disruptions supported the commodity as well.
Yesterday, five pro-Russian militants were killed in eastern Ukraine. In reaction to this, Russian President Vladimir Putin warned there would be consequences if Kiev used force against Ukrainian citizens, and Russia resumed military exercises on its side of the border. Although increased violence in Ukraine renewed concerns that the West could impose sanctions on Russia, we should keep in mind that the U.S. and European Union have already placed some sanctions on Russian and Ukrainian officials, but none of them have affected Russian exports of oil or natural gas.
Meanwhile in Libya, rebels who have took control of export terminals in the eastern part of the country wouldn't reopen two of them as had previously been expected. They accused the central government of failing to abide by the terms of a recent agreement to end the blockade, including paying state salaries to the rebels (who are former oil guards).
Having discussed the above, let’s move on to the technical changes in the crude oil market (charts courtesy of http://stockcharts.com.)
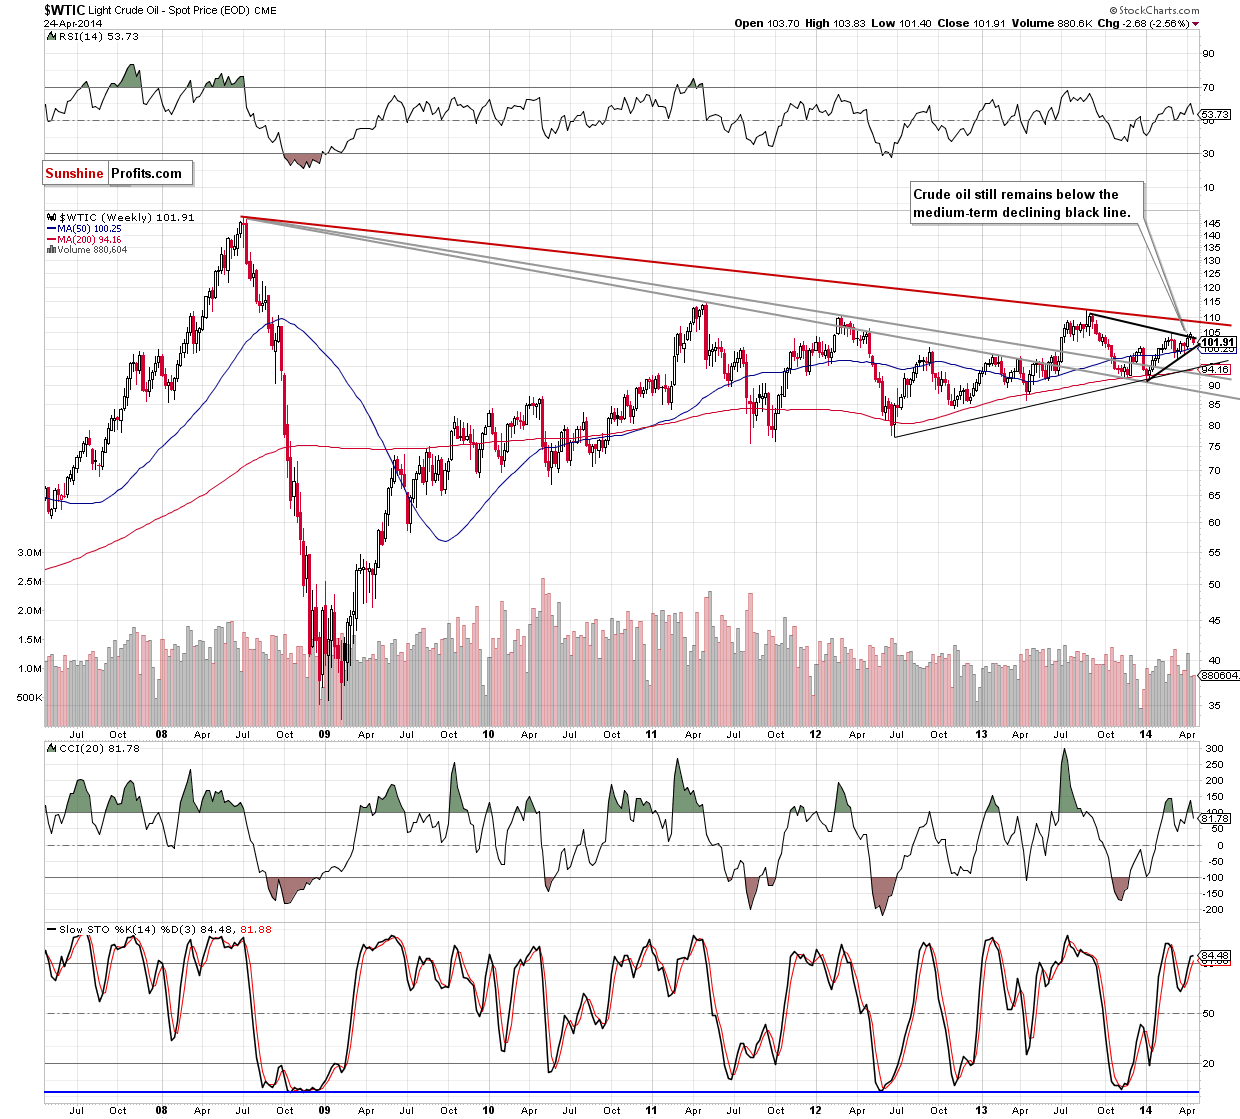
As you see on the weekly chart, the situation hasn’t changed much. Therefore, what we wrote in our previous Oil Trading Alert is still up-to-date.
(…) crude oil gave up the gains and declined below the medium-term resistance line (marked with black). With this move, the commodity invalidated the breakout above this support line, which is a bearish signal. Taking this fact into account, it seems that we may see further deterioration and the downside target for the sellers will be the lower line of a triangle, which corresponds to the 50-week moving average at the moment (around $100.25).
To see the current situation in crude oil more clearly, let’s zoom in on our picture and move on to the daily chart.
In our previous Oil Trading Alert, we wrote the following:
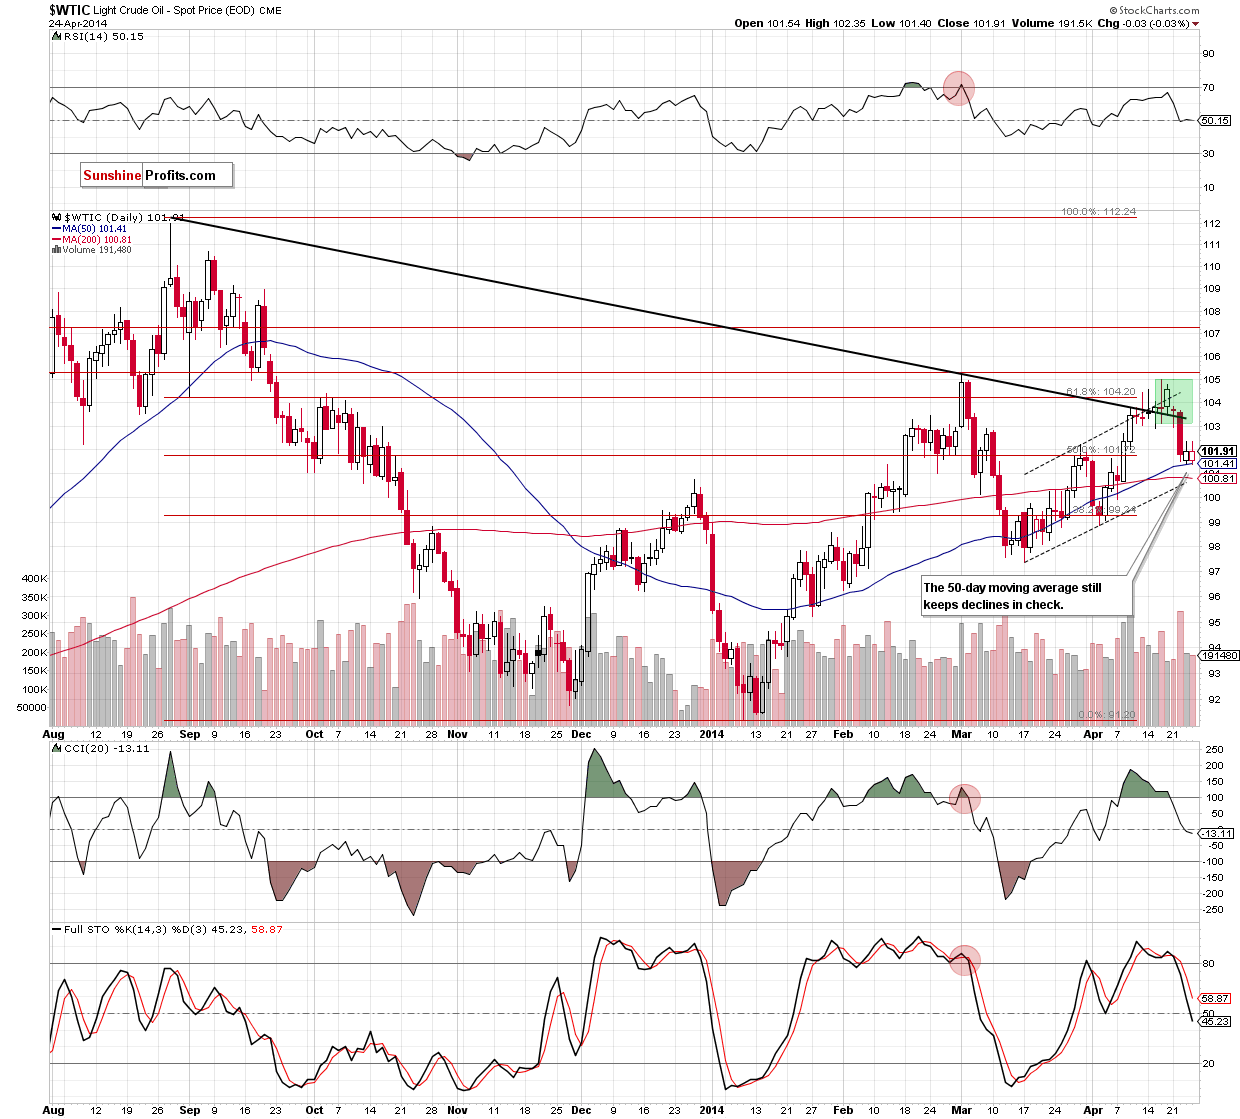
(…) the buyers managed to trigger a corrective upswing that took back light crude above the 50-day moving average. If this support holds and encourages oil bulls to act, we may see an increase to around $102.65, where the 38.2% Fibonacci retracement (based on the recent declines) is.
Looking at the above chart, we see that oil bulls didn’t give up and pushed the order button after the market open. In reaction to this, the price of light cude increased and hit an intraday high of $102.35, approaching the 38.2% Fibonacci retracement. If this resistance level encourages sellers to act, we may see another test of the strength of the 50-day moving average (which still serves as major support). However, if crude oil breaks above this level, we will likely see an increase to the next Fibonacci retracement (around $103.09). At this point, it’s worth noting that slightly above this level is the previously-broken medium-term black line (which is the major resistance at the moment). As a reminder, if the 50-day moving average is broken, the next downside target for the sellers will be the 200-day moving average (currently at $100.81). Please keep in mind that sell signals generated by the indicators remain in place, supporting the bearish case. Therefore, another attempt to move lower should not surprise us.
Summing up, the overall situation hasn’t changed much as crude oil remains between the 50-day moving average and the 38.2% Fibonacci retracement based on the recent declines. Taking this fact into account, it seems that as long as the commodity is trading in this narrow range another sizable move is not likely to be seen. However, if we see a breakout above the resistance level, crude oil may increase to around $103.09, where the next Fibonacci retracement is. On the other hand, if oil bears breaks below the support line, the next downside target will be the 200-day moving average at $100.81. As a reminder, if this area is broken, the next price target will be the lower line of a triangle marked on the weekly chart (currently around $100.25). If this strong support is broken, we’ll consider opening short positions.
Very short-term outlook: mixed with bearish bias
Short-term outlook: mixed with bearish bias
MT outlook: mixed
LT outlook: mixed
Trading position (short-term): In our opinion no positions are justified from the risk/reward perspective. We will keep you informed should anything change, or should we see a confirmation/invalidation of the above.
Thank you.
Nadia Simmons
Forex & Oil Trading Strategist
Przemyslaw Radomski, CFA
Founder, Editor-in-chief
Gold & Silver Trading Alerts
Forex Trading Alerts
Oil Investment Updates
Oil Trading Alerts

