
Trading position (short-term; our opinion): Speculative short positions in crude oil seem to be justified from the risk/reward perspective.
On Thursday, crude oil lost 0.48% as investors weighed economic data from two largest oil consumer nations and the increase in U.S. crude oil inventories. Because of these circumstances, light crude hit a 6-week low and reached a support level. Will all bearish technical factors push the price lower?
Yesterday, official data showed that China’s manufacturing purchasing managers’ index increased to 50.4 in April, missing expectations for a 50.5 reading. Additionally, later in the day, the U.S. Department of Labor showed that the number of people filing for initial jobless benefits increased by 14,000 to a seasonally adjusted 344,000 last week (while analysts had expected a drop by 11,000 to 319,000). These disappointing numbers pressured the price of light crude below $99. However, better-than-expected consumer spending and manufacturing figures cushioned losses. The Commerce Department reported that U.S. personal spending rose 0.9% in March (beating expectations of 0.6%), while personal income rose 0.5% (above expectations for a 0.4% increase). Also yesterday, the Institute for Supply Management showed that its manufacturing PMI rose to 54.9 in April (also above expectations for a 54.3 growth).
Meanwhile, investors remained concerned over record-high U.S. crude supply levels. On Wednesday, the U.S. Energy Information Administration showed in its weekly report that crude oil inventories rose by 3.52 million barrels last week and hit an all-time high of 399.4 million barrels.
Having discussed the above, let’s move on to the technical changes in the crude oil market (charts courtesy of http://stockcharts.com.)
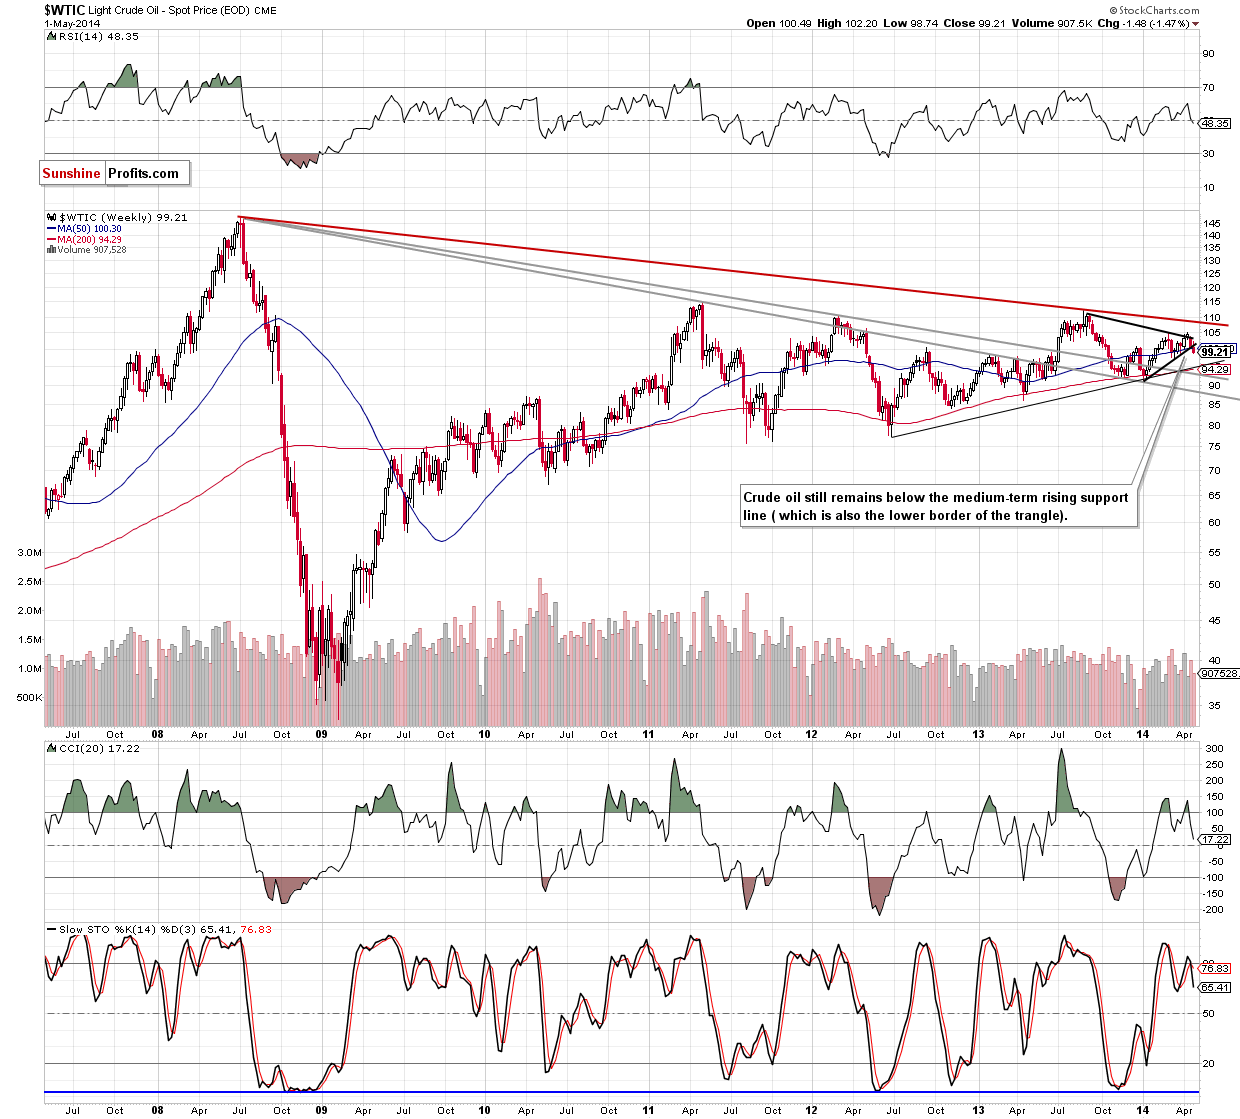
Looking at the weekly chart, we clearly see that the situation has deteriorated as crude oil extended declines below the lower border of the triangle and dropped below the psychological barrier of $100. Although the breakdown is not confirmed, in our opinion, furter deterioration is likely to be seen. Therefore, the bearish scenario from our Oil Trading Alert posted on Wednesday is up-to-date.
(…) if the commodity extends losses and drops below the psychological barrier of $100, we will likely see further deterioration and a drop even to around $95, where the medium-term support line (based on the June 2012 and January 2014 lows) is. At this point, it’s worth noting that the CCI and Stochastic Oscillator generated sell signals, which suggests that another attempt to move lower should not surprise us.
Once we know the situation from the weekly perspective,let’s zoom in on our picture and move on to the daily chart.
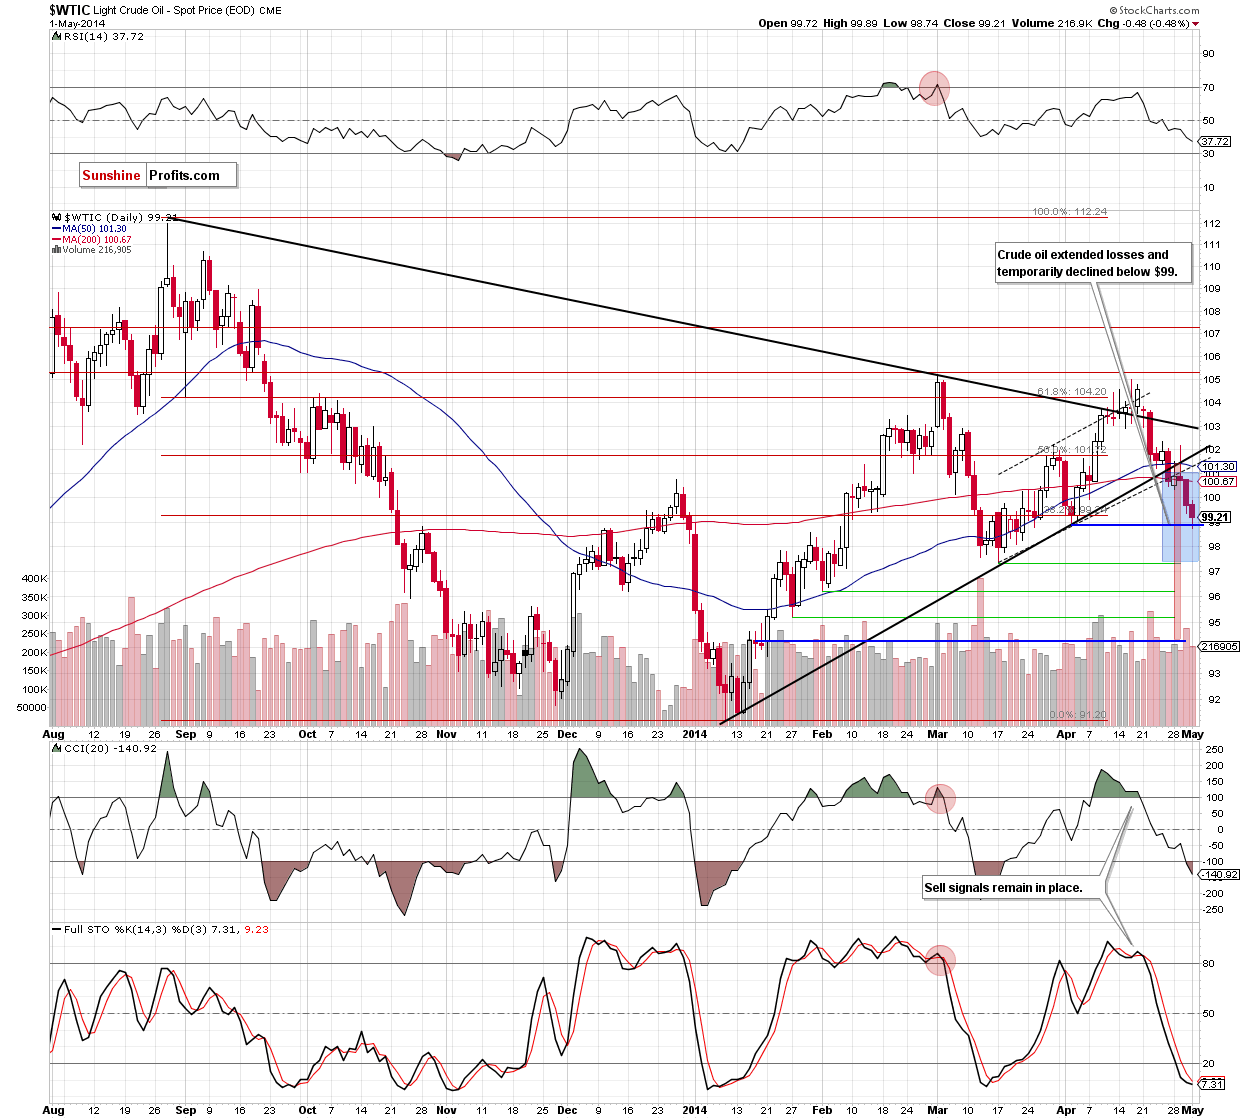
As you see on the above chart, crude oil moved lower once again and reached the bottom of the correction that we saw at the turn of March and April. If this support level holds, we may see a corrective upswing in the coming day and the first upside target will be the previously-broken level of $100. If it is broken, light crude will likely drop to one of its downside targets that we discussed in our previous Oil Trading Alert:
(…) In the case of the breakdown under the lower border of the trend channel, declines may push the price to around $97, where the size of the downswing will correspond to the height of the formation. Nevertheless, in our opinion, the confirmation of the breakdown below the medium-term line is more important because it suggests an even bigger move. of its implication. In this case, the correction may be deeper and take light crude to around $94.20. At this point, it’s worth noting that the first downside target is supported by the March low of $97.37 and the latter corresponds to the 78.6% Fibonacci retracement based on the entire Jan.-March rally.
Before we summarize, please note that all bearish factors that we noticed in the previous days (a confirmation of the breakdown below the the lower border of the medium-term triangle and the lower border of the short-term trend channel, the breakdown in the USO ETF and the drop below the key level of $100) suggest that we’ll see the bearish scenario in the coming days.
Summing up, crude oil extended losses and hit a 6-week low. Although the commodity rebounded slightly after a drop to the April 2nd low, it still remains below the key level of $100 and two other important resistance lines. Therefore, in our opinion, as long as there won’t be an invalidation of the breakdown below these lines, further deterioration is likely to be seen.
Very short-term outlook: bearish
Short-term outlook: bearish
MT outlook: mixed
LT outlook: mixed
Trading position (short-term): Short. Stop-loss order: $102.50. We will keep you informed should anything change, or should we see a confirmation/invalidation of the above.
Thank you.
Nadia Simmons
Forex & Oil Trading Strategist
Przemyslaw Radomski, CFA
Founder, Editor-in-chief
Gold & Silver Trading Alerts
Forex Trading Alerts
Oil Investment Updates
Oil Trading Alerts

