
On Friday crude oil gained 1.20% as expectations that signs of an improving U.S. economy could translate to higher crude demand in the world's largest oil consumer. In this way, light crude extended its gains and hit a seven-week high of $99.48.
In our previous Oil Trading Alert, we wrote that if the Fed decided to move toward tapering its bond buying program, it would suggest that the U.S. economy is recovering and, as is well known, an improving economy means that oil demand may grow, which would likely trigger a move up in light crude. Yesterday, we saw such an improvement as crude oil rallied to slightly below the psychological barrier of $100 per barrel.
It seems that investors are now taking the Fed action as a sign that further economic gains are likely. This could mean additional fuel consumption across the country, which is in tune with the Thursday’s American Petroleum Institute report. According to the API, U.S. oil demand rose 4.9% year-on-year in November on signs of broader strengthening in the nation's economy. At 19.435 million barrels a day, demand in the world's biggest oil consumer was the highest since December 2010. API's report also showed strong gains in demand for gasoline, as well as in jet fuel and other oils.
Having discussed the above, let’s move on to the technical changes in the crude oil market (charts courtesy of http://stockcharts.com).
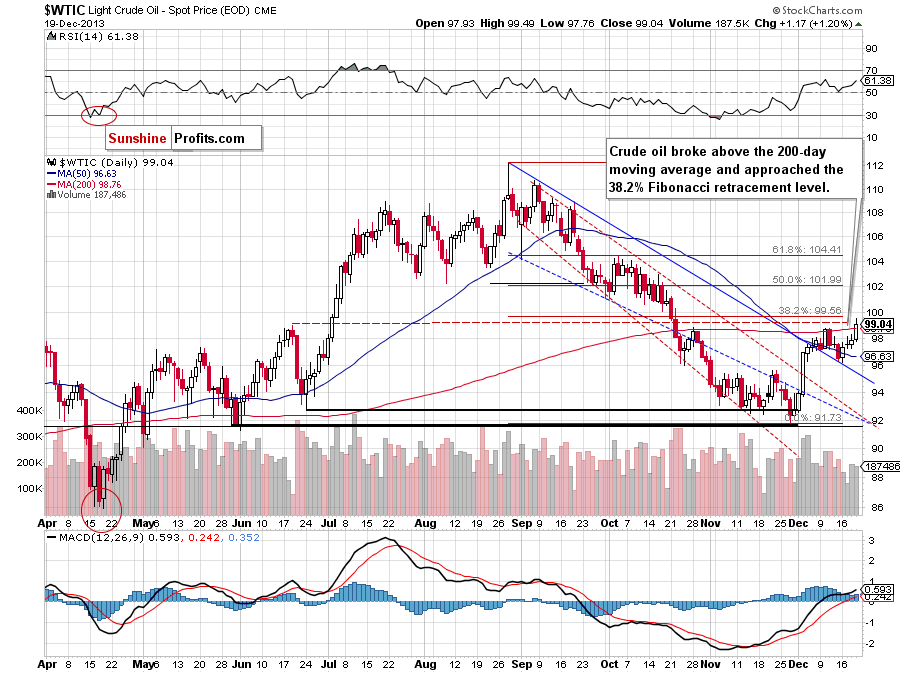
Looking at the above chart, we see that the situation has improved significantly. Yesterday, after the market open, the buyers didn’t give oil bears a chance to show their claws and triggered an upward move, which pushed the price not only above the Wednesday high, but also above the nearest major short-term resistance - the 200-day moving average. As a reminder, this strong resistance stopped gains at the end of October and also at the beginning of the previous week. In this way crude oil climbed to its daily high of $99.48 and almost reached the 38.2% Fibonacci retracement level (at $99.56). Taking into account this resistance level and the psychological barrier of $100, a pause or a pullback should not surprise us. However, if oil bulls manage to successfully break above this strong resistance zone, the next upside target will be around $102 where the 50% Fibonacci retracement level is.
Please note that the nearest support is around $97.26, where the Tuesday low is. The next is the 50-day moving average (currently at $96.63).
Having discussed the current situation in crude oil, let’s take a look at WTI Crude Oil (the CFD).
In our previous Oil Trading Alert, we wrote:
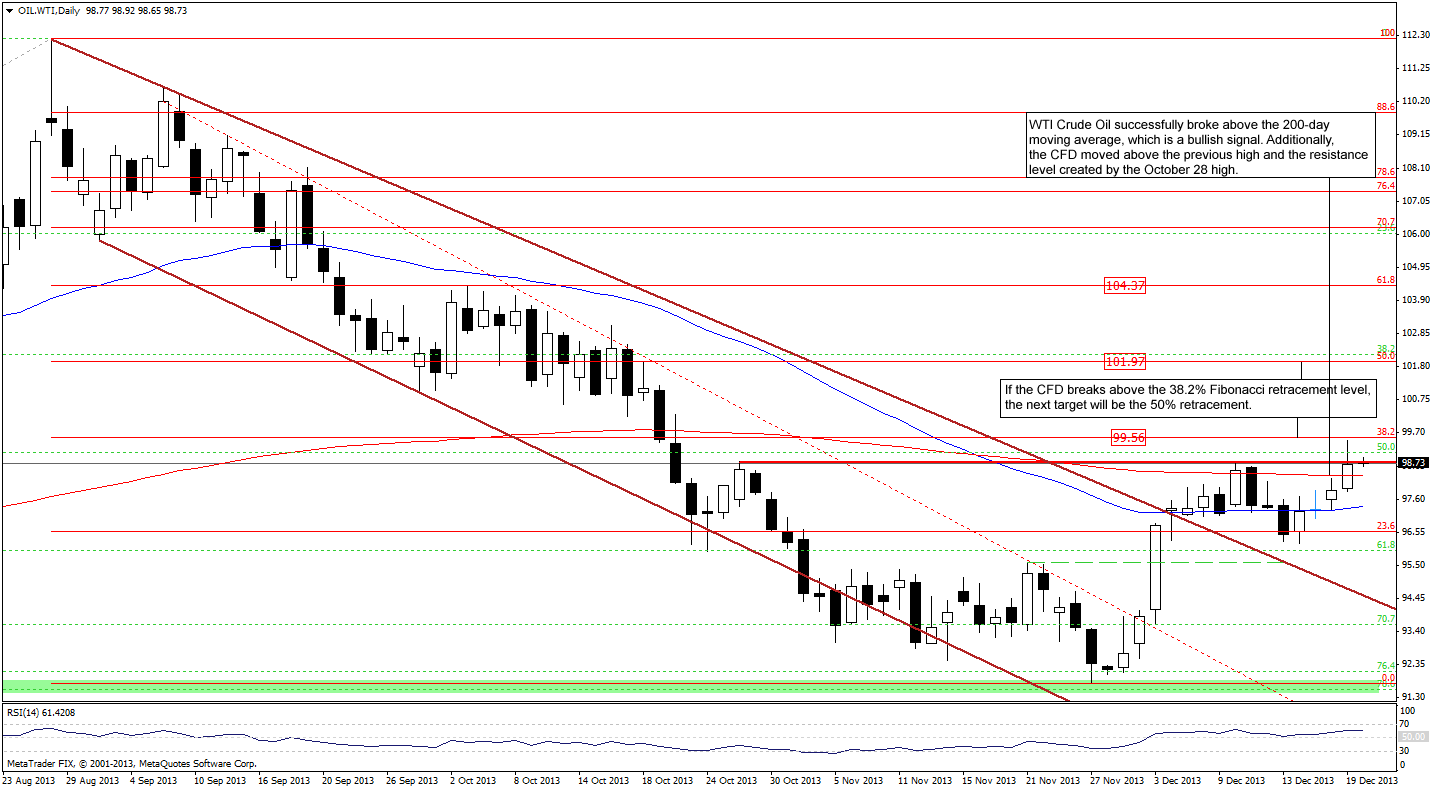
(...) although the CFD reached its first upside target, it didn’t give up the gains and today (at least at the time when these words are written) is trading near its yesterday’s high, which is a positive sign. From this perspective, it seems that we may see another attempt to break above the 200-day moving average in the near future.
Looking at the above chart, we see that WTI Crude Oil extended its gains yesterday and successfully broke not only above the 200-day moving average, but also above the resistance level, which stopped further growth at the beginning of the previous week. In this way, the CFD hit its daily high of $99.47 and almost touched the 38.2% Fibonacci retracement level. Similarly to what we wrote in case of crude oil, if this resistance is broken, the upside target will be the 50% Fibonacci retracement level (around $102). Please note that the RSI is not overbought at the moment and it still has some room for further growth, which supports the bullish case.
However, if the CFD invalidates the breakout above the resistance level (and the previous high) we will likely see a pullback to the 200-day moving average, which serves as nearest support.
Please note that our last week’s assumption remains up to date: “(…) taking into account the fact that crude oil and WTI Crude Oil move together in the same direction, it seems that a move in the CFD will trigger a similar move in light crude.”
Once we know the above, let’s take a look at the NYSE Arca Oil Index (XOI) weekly chart.
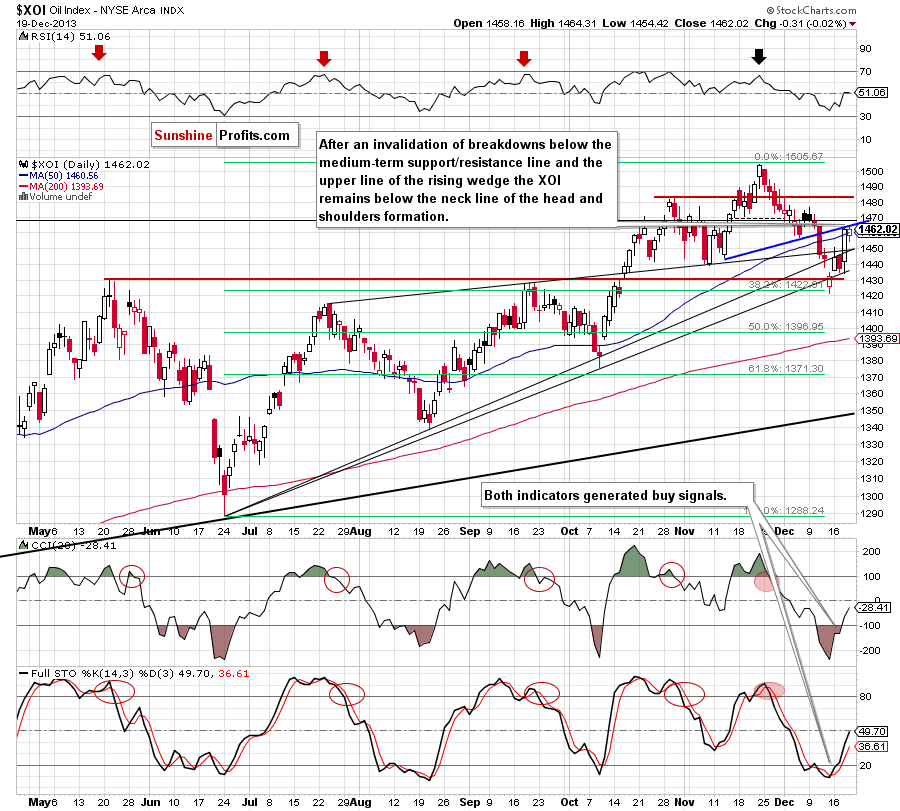
Looking at the above chart, we see that the situation hasn’t changed much. After an invalidation of the breakdown below the upper medium-term rising support/resistance and the upper line of the rising wedge (which was a strong bullish signal), the oil stock index remains near the Wednesday high. Therefore, what we wrote in our previous Oil Trading Alert remains up-to-date also today.
(..) we should keep in mind that this area (around 1,463) is reinforced by the upper line or the medium-term rising wedge (you can see this line more clearly on the weekly chart right here). Therefore, a pause or pullback should not surprise us. If the XOI breaks above this major medium-term resistance, we will likely see an upswing to at least 1,476 or even to 1,483 where the previously 2013 high is.
Finishing this part of our Oil Trading Alert, please note that the CCI and Stochastic Oscillator generated buy signals, which supports further improvement in the near future.
Summing up, the most important improvement of yesterday‘s session was the breakout above the 200-day moving average, which is a bullish sign. In this way, crude oil approached its strong resistance created by the 38.2% Fibonacci retracement level and the psychological barrier of $100. Taking these circumstances into account, a pause or a pullback should not surprise us but the situation remains bullish.
Very short-term outlook: bullish
Short-term outlook: bullish
MT outlook: mixed with bullish bias
LT outlook: mixed
Trading position (short-term): Long. Stop-loss order for this position: $91.55. Stop-loss order for WTI Crude Oil (CFD): $91.30. We will keep you informed should anything change, or should we see a confirmation/invalidation of the above.
Thank you.
Nadia Simmons
Sunshine Profits' Crude Oil Expert
Oil Investment Updates
Oil Trading Alerts

