
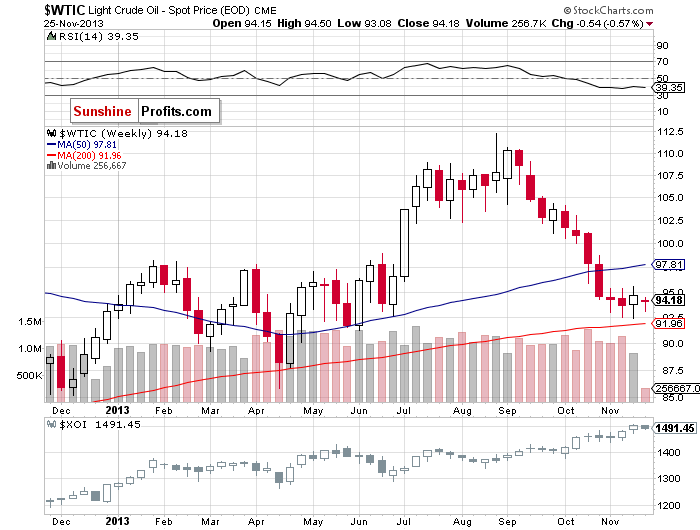
On Wednesday, crude oil extended its decline and hit a fresh monthly low of $91.77 as the U.S. Energy Information Administration (EIA) data showed a much larger-than-expected rise in U.S. crude inventories. In this way, light crude lost 1.22% and dropped to the levels that we saw at the beginning of June.
Crude oil dropped to the lowest level in almost six months after the EIA data release. The EIA said in its weekly report that crude oil supplies grew by 3 million barrels to 391.4 million barrels in the week ended Nov. 22 (which was significantly above expectations). Please note that this is the 10th straight week of crude stockpile increases. Crude oil stocks have climbed by 35.8 million barrels, or 10%, over the past ten weeks and are at their highest level since Jun. 21.
In our Wednesday’s Oil Trading Alert we wrote the following:
(…) if we see such (or lower) increase, the price of light crude will likely move higher – similarly to what we saw a week ago. However, if the data is better-than-expected, crude oil will probably re-test the November low.
This much larger-than-expected rise in U.S. crude inventories had a very negative impact on light crude. Similarly to what we had seen in the middle of the month, crude oil extended losses and hit a fresh monthly low. With this downward move, light crude slipped to the next support level created by the May low (in terms of daily closing prices).
Taking the above into account, we clearly see that the crude oil sector is currently at a critical juncture. What's more important, is that this point is critical not from the short-term perspective, but from the medium-term one. Therefore, this time we would like to draw your attention to the weekly chart below (charts courtesy of http://stockcharts.com).
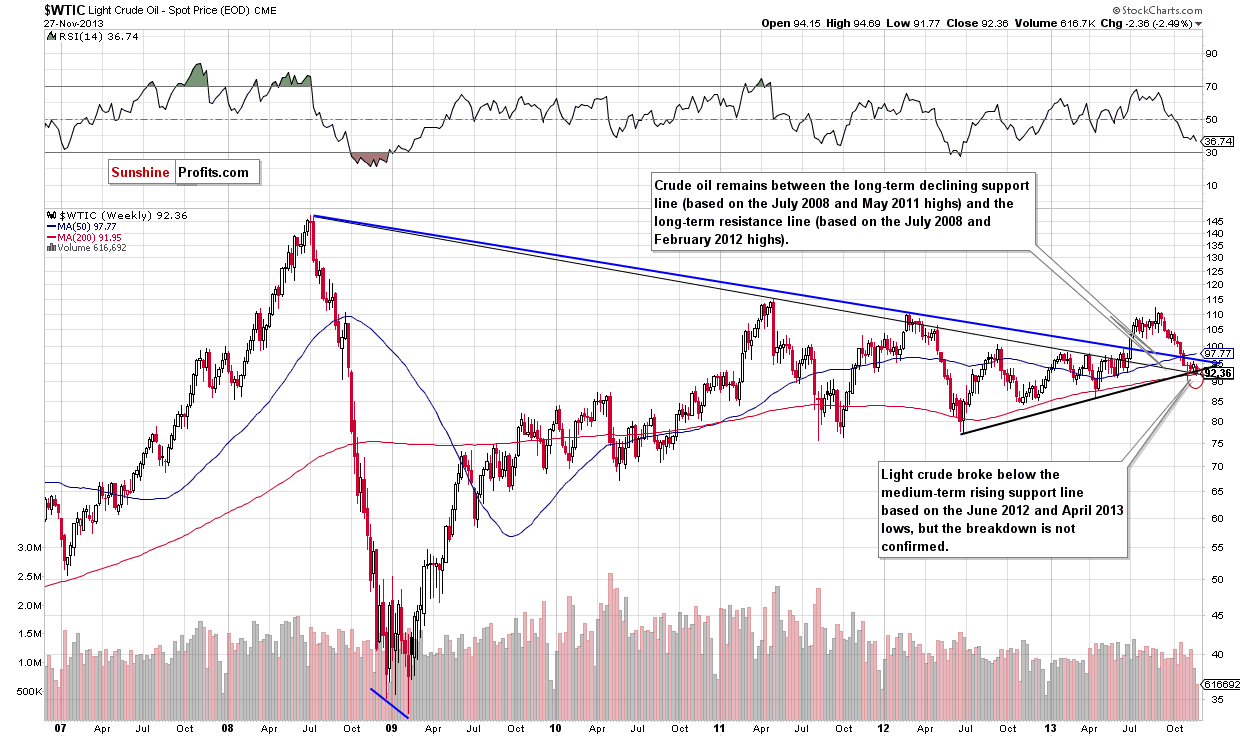
The oil price moved to the place where two major support lines intersect - the declining one based on the 2008 and 2011 highs, and the rising one based on the 2012 and 2013 lows. We saw an insignificant daily move below the latter, but crude oil stayed above the former. At this time, the breakdown is not confirmed and taking short positions would be premature and too risky in our view.
Earlier this month, in our Oil Investment Update we examined the oil-to-oil-stocks ratio in the medium term. Today, we’ll focus on the long-term chart.
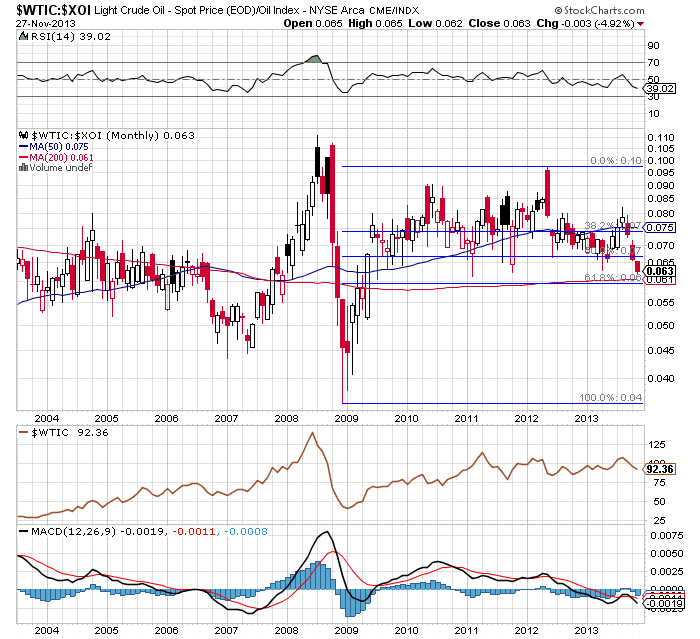
The WTIC:XOI ratio verified the breakdown below the support line based on the 2012 and 2013 lows, so crude oil could become even more oversold relative to the oil stocks - which might happen, if the above-mentioned breakdowns in the price of crude oil are confirmed.
From a long-term point of view, we have the 61.8% Fibonacci retracement level based on the 2008 - 2012 rally in the WTIC:XOI ratio visibly below the current value of the ratio, which further supports the above. Simply put, because the breakdown in the ratio was confirmed, we are no longer counting on a reversal in the price of crude oil based on its oversold status relative to the oil stocks.
Normally (historically), crude oil and oil stocks either rallied together or declined together. At this time, we have a lasting anomaly - oil declines while oil stocks rally. You can see this situation more clearly on the chart below.
On top of that, we have a situation in which oil stock follow the general stock market (underperforming it, but still, they’re moving quite in tune with it), which doesn't help us detect changes in the crude oil prices based on the oil stock prices. This important connection (oil - oil stocks) will be surely back in the future (the fundamental relationship between the two guarantees that), but it's not really useful at this time (we will monitor both of them on a continuous basis anyway).
Summing up, looking at the current situation in crude oil, the best approach at this time in our view is to (we know you won't like it, but we have to describe the situation as we view it) wait and see how crude oil reacts to the current combination of the long-term support levels. If they are broken, we will likely see a major decline and we will likely suggest opening short positions. If we see a strong bounce and a beginning of a rally, we will suggest going long. For now, we will adhere to an old Wall Street saying: "when in doubt, stay out".
Very short-term outlook: bearish
Short-term outlook: bearish
MT outlook: bearish
LT outlook: unclear
Trading position (short-term): Taking into account the long-term support lines, we do not suggest opening short positions at the moment. We will keep you informed should anything change, or should we see a confirmation/invalidation of the above.
Thank you.
Nadia Simmons
Sunshine Profits' Crude Oil Expert
Oil Investment Updates
Oil Trading Alerts

