
On Thursday, crude oil declined to a new monthly low of $92.51 as the U.S. Energy Information Administration (EIA) data showed a much-larger-than-expected rise in U.S. crude inventories. However, light crude quickly reversed course after Federal Reserve Chair Nominee Janet Yellen told that monetary stimulus tools shouldn't be removed too soon. Thanks to this comment, crude oil gained 0.51% and closed the day slightly below $94 per barrel.
Crude oil extended losses to a five-month low after the EIA data release. The EIA said in its weekly report that crude oil supplies grew by 2.6 million barrels, far more than the 1 million barrels predicted by analysts. Please note that this is the eighth straight weekly rise. Additionally, stocks at U.S. storage hub in Cushing, Oklahoma, rose by 1.7 million barrels, confirming an earlier report.
Despite this drop, light crude quickly rebounded as investors digested the numbers, which showed that gasoline inventories fell by 800,000 barrels, exceeding expectations for a 700,000-barrel draw. Gasoline stocks have dropped for five straight weeks and are at their lowest point since Nov. 23, 2012.
As mentioned above, Federal Reserve Chair Nominee Janet Yellen comments gave oil a boost. Yellen told the Senate Banking Committee that the U.S. central bank's $85 billion in monthly bond purchases have and will continue to support the economy until more sustained recovery becomes evident, stressing the need not to yank the program out too soon.
Her comments weakened the dollar, which also came under pressure amid sentiments that even when the Fed begins to taper the pace of its monthly asset purchases, be it in December or in early 2014, monetary tightening is still a long way away. Keep in mind that the Fed's stimulus program could weaken the greenback by driving down interest rates to spur recovery, making oil an attractive buy on dollar-denominated exchanges (that is if other monetary authorities don’t print their fiat money at a faster pace than the Fed).
Once we know these major factors which had an impact on light crude, let’s move on to the technical changes in the crude oil market (charts courtesy of http://stockcharts.com).
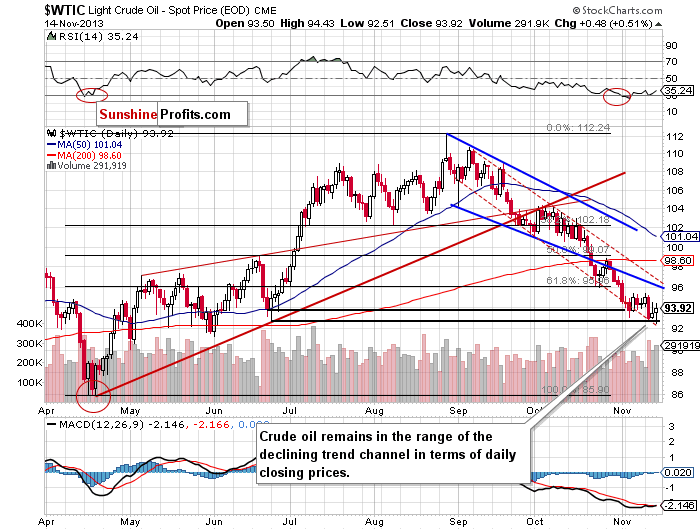
Yesterday, after the market open crude oil declined and hit a fresh five-month low of $92.51. With this downward move, light crude reached the lower border of the declining trend channel in terms of daily closing prices (marked with the red dashed line)once again. At the same time we noticed a small breakdown below the bottom of the corrective move that we saw in June (in terms of intraday lows). In spite of this drop, crude oil quickly bounced off this level and the breakdown was invalidated. In the following hours we saw further improvement and light crude climbed to its intraday high of $94.43. Please note that an invalidation by itself is a bullish signal. Additionally, Thursday’s increase materialized on relatively big volume, which is another bullish sign.
When we take a closer look at the position of the RSI, we notice that it still remains slightly above the 30 level. Taking this fact into account, we have a positive divergence between the indicator and the price of light crude, which is also a bullish sign.
Once we know the current situation in crude oil, let’s move on to the XOI daily chart.
Quoting our previous Oil Trading Alert:
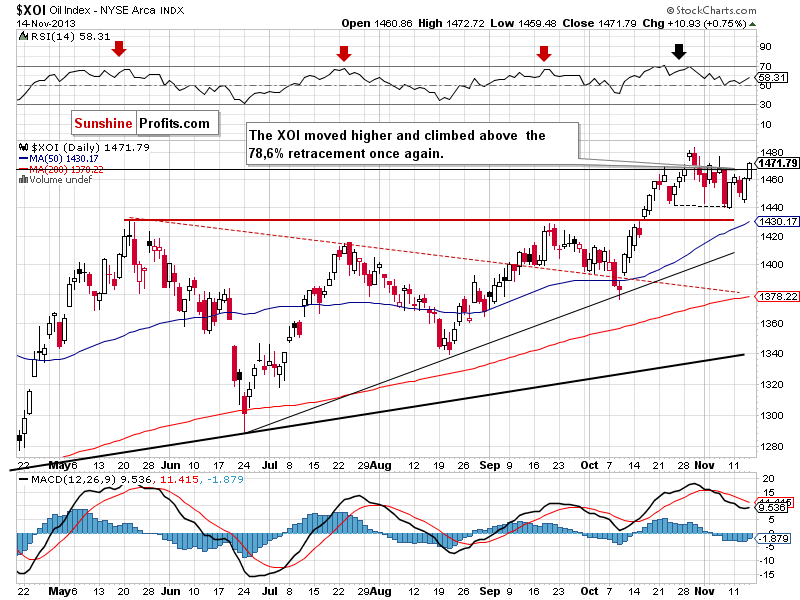
(...) If the buyers do not give up and push the oil stock index higher once again, we will likely see another attempt to close above this important resistance level.
As you can see on the above chart, yesterday we saw such price action. After the open, the XOI continued its rally and climbed to an intraday high at 1,472. In this way, the oil stock index broke above the 78.6% Fibonacci retracement level once again. If the breakout is not invalidated, we will likely see a continuation of the recent upswing. Please note that the nearest resistance level is the Nov. 6 high at 1,476 and the next one is the 2013 high.
Keep in mind that in spite of the recent growth, a sell signal generated by the MACD is still in play and may encourage sellers to act. In this case, the nearest support zone is created by Wednesday’s low and the bottom of the recent corrective move (between 1,439 and 1,444).
Summing up, although crude oil hit a fresh monthly low and dropped below the bottom of the June corrective move (in terms of intraday lows), it quickly bounced off this level and invalidated the breakdown, which by itself is a bullish signal. Additionally, Thursday’s increase materialized on relatively big volume, which is another bullish sign. A positive divergence between the RSI and the price of light crude is another bullish factor. On top of that, crude oil still remains in the declining trend channel in terms of daily closing prices and the long-, medium- and short-term support levels are still in play.
Very short-term outlook: bearish
Short-term outlook: bearish
MT outlook: bearish
LT outlook: unclear
Trading position (short-term): Taking into account the medium- and short-term picture, we do not suggest opening any positions.
Thank you.
Nadia Simmons
Sunshine Profits' Crude Oil Expert
Oil Investment Updates
Oil Trading Alerts

