
On Tuesday, crude oil gained 1.50% as market participants digested news of progress toward opening the TransCanada Corp pipeline to move oil from the U.S. Midwest to the Gulf, helping drain crude from Cushing, Oklahoma. The news fueled expectations of a decline in crude stockpiles for a second week in a row and pushed crude oil to its highest level since Oct. 28.
Two new pipelines are set to drain oil from Cushing in the next few months - a 700,000 barrel-per-day (bpd) TransCanada Corp pipeline and a Royal Dutch Shell pipeline to send crude to Louisiana. Although the reduction in crude stockpiles at Cushing will depend on whether or not the TransCanada pipeline operates smoothly and how well Gulf Coast refiners can absorb the supply from Shell's pipeline, yesterday’s news fueled expectations of a decline in U.S. inventories and pushed the price to a six-week high.
Taking the above into account, market players looked ahead to data from the U.S. Energy Information Administration (EIA) later in the day to gauge the strength of demand from the world’s largest oil consumer. If its weekly report would show another reduction, it will be a positive sign for demand, which will likely push the price higher. Please note that analysts forecast a drawdown on U.S. oil inventories of 2.95 million barrels for the week ended Dec. 6.
Yesterday, after markets closed, the American Petroleum Institute said that U.S. crude inventories fell by 7.5 million barrels in the week ended Dec. 6, compared to expectations for a decline of 2.8 million barrels. As a reminder, in the previous week, the EIA weekly report showed that crude oil stocks fell far less than the drop reported late Tuesday by the American Petroleum Institute, which pushed crude oil lower. So, what is the clue for today? First of all, investors should focus on whether the data are better or weaker than expected. Secondly, compare the EIA weekly report with the one from the American Petroleum Institute. If it is weaker, we may see similar price action and lower values of crude oil.
Having discussed the above, let’s move on to the technical changes in the crude oil market (charts courtesy of http://stockcharts.com).
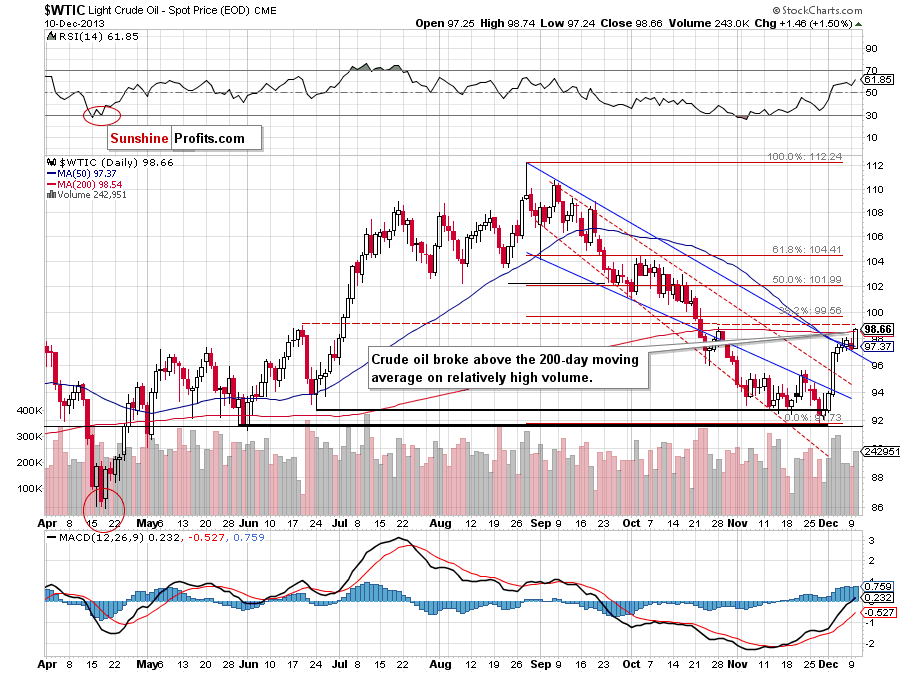
Looking at the above chart, we see that the most significant improvement is the breakout above the 200-day moving average. Additionally, yesterday’s increase materialized on relatively high volume, which confirms the strength of the buyers. Taking these positive circumstances into account, we will likely see further growth and the nearest price target for oil bulls will be the 38.2% Fibonacci retracement level around $99.55.
Please note that despite the Monday drop, the breakout above the upper line of the declining trend channel was not invalidated and it still serves as support.
Having discussed the current situation in crude oil, let’s take a look at WTI Crude Oil (the CFD).
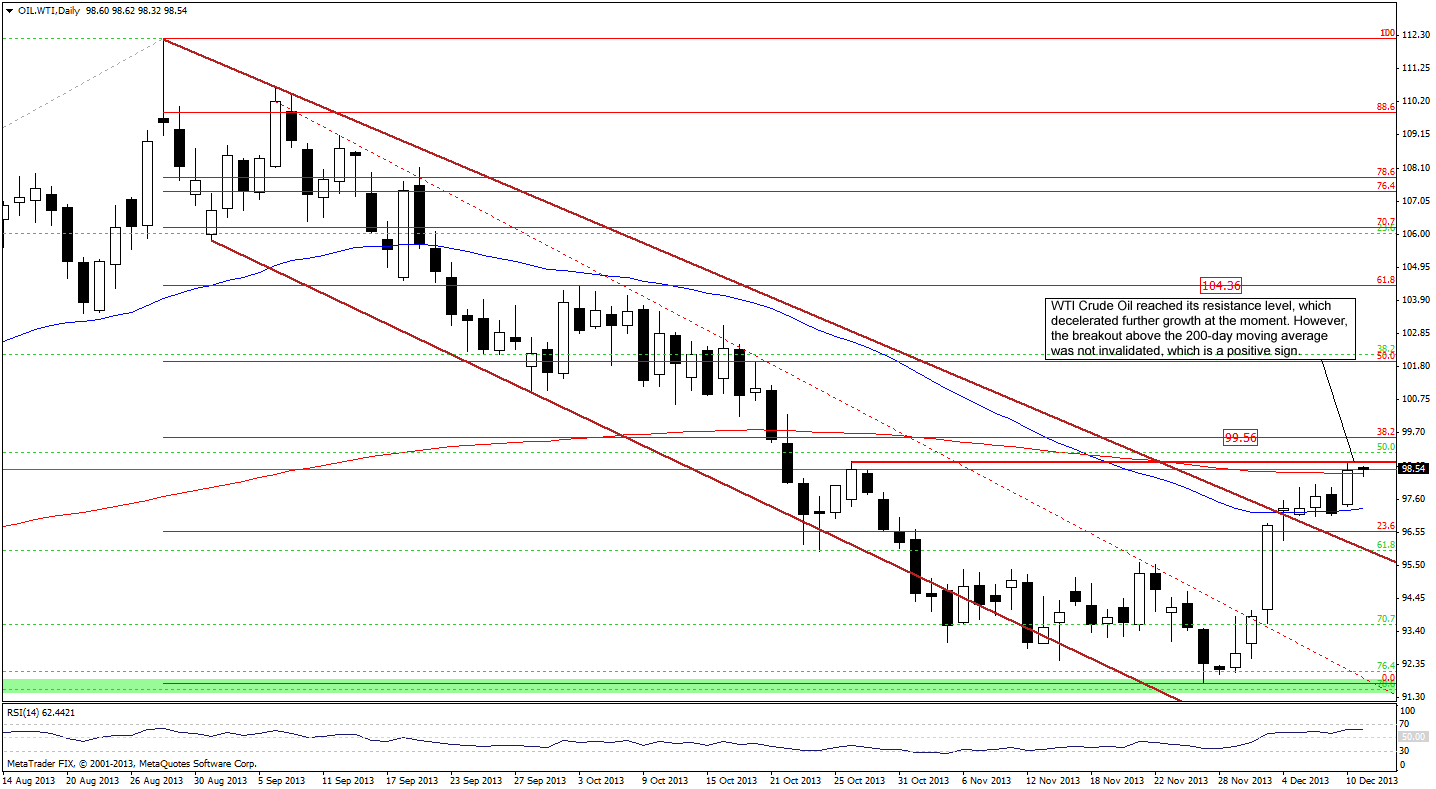
Looking at the above chart we see that WTI Crude Oil reached its resistance level, which decelerated further growth at the moment. Despite the little drop, the breakout above the 200-day moving average was not invalidated, which is a positive sign. Please note that our yesterday’s assumption: “if we see further improvement in WTI Crude Oil, we will likely see similar price action in crude oil in the following days” is still up-to-date.
Taking this fact into account, we can conclude that if this very short-term resistance level is broken, the next price target for buyers will be the 38.2% Fibonacci retracement level around $99.55. The nearest support is created by the previously-broken upper line of the declining trend channel and reinforced by the 23.6% Fibonacci retracement level.
Once we know the above, let’s take a look at the NYSE Arca Oil Index (XOI) weekly chart.
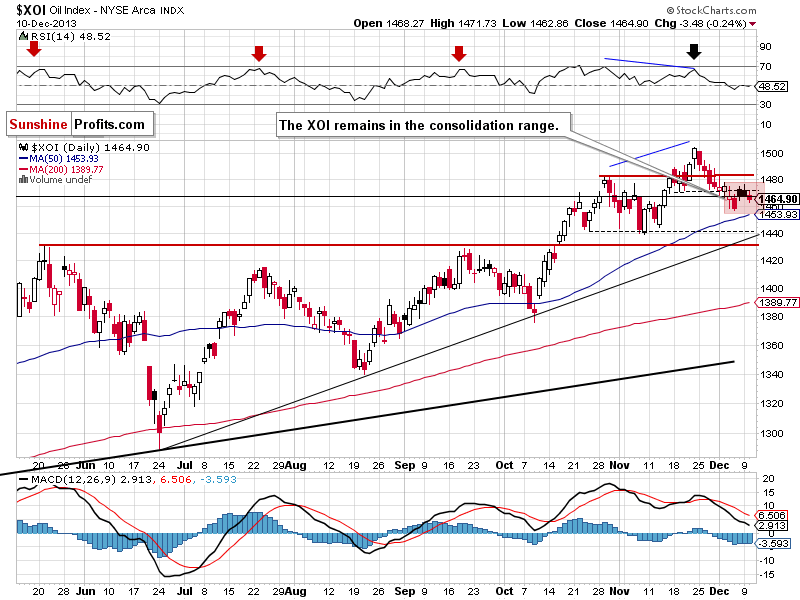
Looking at the above chart, we see that the situation didn’t change much yesterday. The oil stock index remains in the consolidation range slightly above the upper line of the rising wedge (around 1,463). Therefore, what we wrote in our Oil Trading Alert on Monday remains up-to-date.
(…) If the XOI moves above 1,475, we may see further improvement and an attempt to move above 1,483 (the previous 2013 top). On the other hand, if oil stocks drop below 1,457, we will likely see further deterioration. In this case, the first downside target will be the 50-day moving average (currently at 1,453). If it’s broken, we may see a downward move to a support zone created by the upper line of the rising wedge (marked with the thin black line) and the bottom of the correction that we saw at the beginning of November (around 1,440-1,446).
Summing up, the most significant improvement is the breakout above the 200-day moving average, which materialized on relatively high volume and confirms the strength of the buyers. It seems that we will see further growth to the 38.2% Fibonacci retracement level around $99.55.
Very short-term outlook: bullish
Short-term outlook: bullish
MT outlook: mixed with bullish bias
LT outlook: mixed
Trading position (short-term): Long. Stop-loss order for this position: $91.55. Stop-loss order for WTI Crude Oil: $91.30. We will keep you informed should anything change, or should we see a confirmation/invalidation of the above.
Thank you.
Nadia Simmons
Sunshine Profits' Crude Oil Expert
Oil Investment Updates
Oil Trading Alerts

