
On Friday, crude oil lost 1.25% as expectations for an increase in oil supply from Libya and concerns over a build-up in U.S. inventories weighted on the price. With this downward move, light crude extended the previous sessions losses and hit a fresh monthly low of $93.86 per barrel.
At the end of the previous week, Libya’s National Oil Corporation said that exports could soon return to near normal levels after political protesters agreed to stop months of blockages. As a reminder, output from the OPEC-member had fallen to 250,000 bpd from 1.4 million bpd in July, boosting international oil prices. Meanwhile, the resumption of Libya's El Sharara field could lift the country's production to 600,000 barrels per day, which is bearish for crude oil and drove the price lower in recent days.
On Friday, the Energy Information Administration said that crude oil inventories fell by 7.01 million barrels in the previous week, far above market expectations for a decline of 2.98 million barrels. However, it seems that market players attributed much of the unexpectedly large decline to year-end accounting. Additionally, distillate fuel, which includes diesel and heating oil, rose by 5.04 million barrels, well above expectations for a gain of 1.23 million and overshadowed the sharp decline in oil inventories.
Having discussed the above, let’s move on to the technical changes in the crude oil market (charts courtesy of http://stockcharts.com).
Quoting our previous Oil Trading Alert:
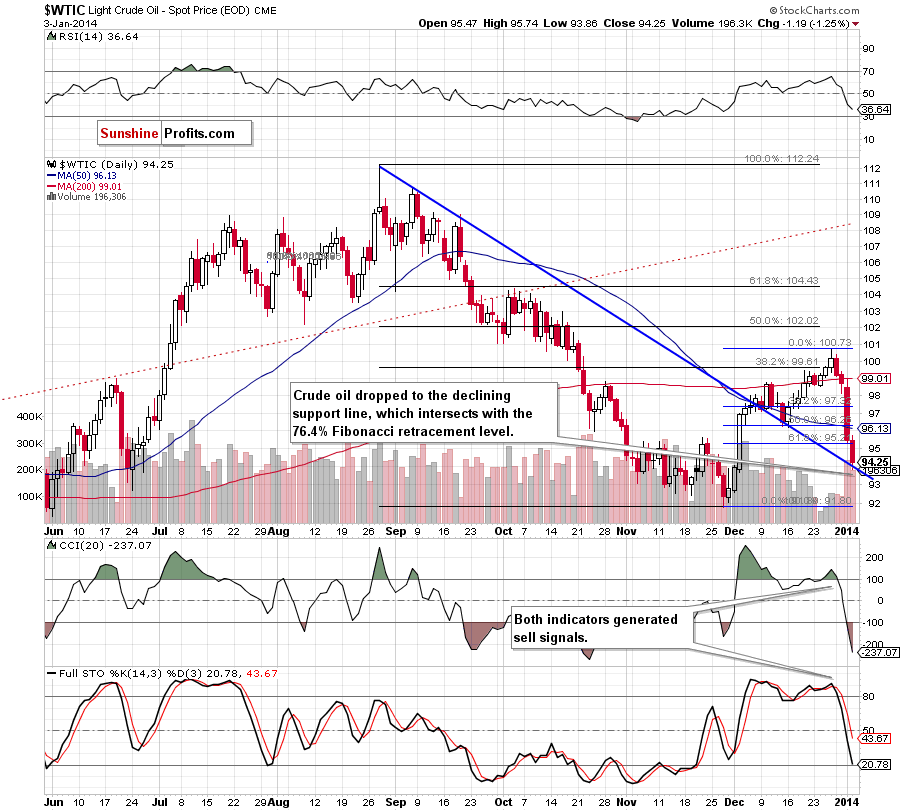
(…) we should consider two scenarios. If the 61.8% Fibonacci retracement encourages oil bulls to act, we will likely see an upside correction that will take the price to at least $96.21, where the previously-broken 50-day moving average is. On the other hand, if the buyers fail and crude oil drops below this strong support level, we will likely see further deterioration and the next downside target will be around $94.08 where the Dec. 2 high intersects with the short-term declining support line (marked in blue).
Looking at the above chart, we clearly see that oil bears realized their own scenario on Friday. Although we saw a small (actually a very small) upswing after the market open, the buyers didn’t even manage to push the price to the 50-day moving average. This show of weakness encouraged sellers to trigger another downward move, which took crude oil to the short-term declining support line (marked in blue). As a reminder, this support line successfully stopped further deterioration in December. If history repeats itself once again, we will likely see an upward correction in the coming day (or days). Please note that this area is also supported by the 76.4% Fibonacci retracement level based on the entire Nov.-Dec. rally.
Before we discuss the current situation in WTI Crude Oil, we would like to draw your attention to the weekly crude oil chart.
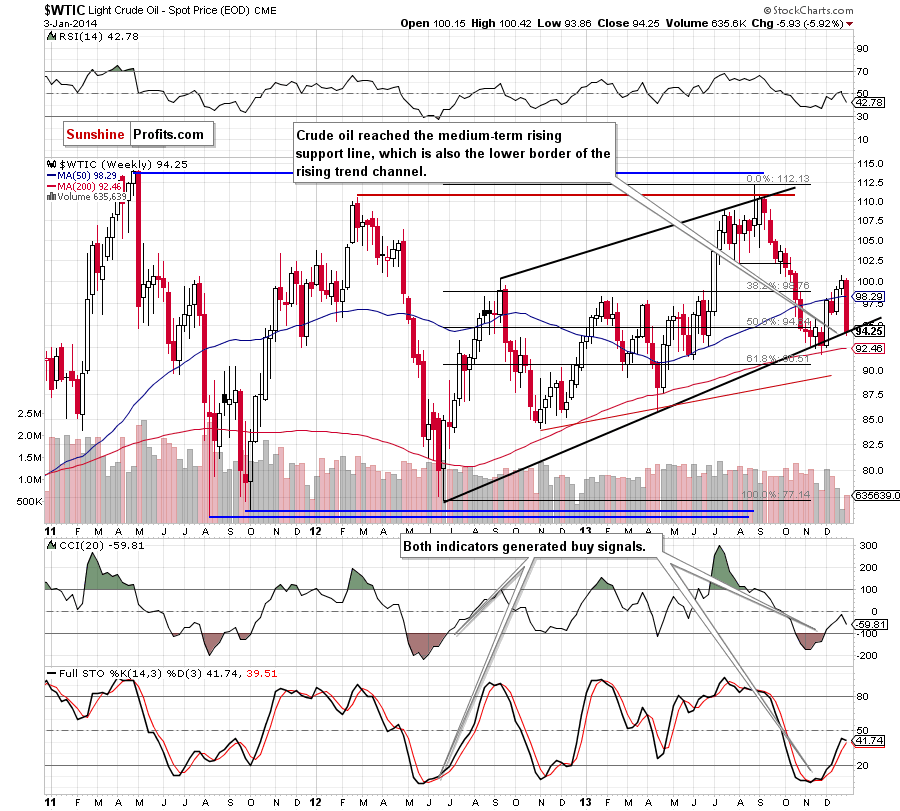
On the weekly chart, we clearly see that light crude reached the medium-term support line based on June 2012 and April 2013 lows, which is also the lower border of the rising trend channel. At the end of November, this strong support successfully stopped further declines. We could see similar price action this week.
Having discussed the above, let’s take a look at WTI Crude Oil (the CFD).
Quoting our last Oil Trading Alert:
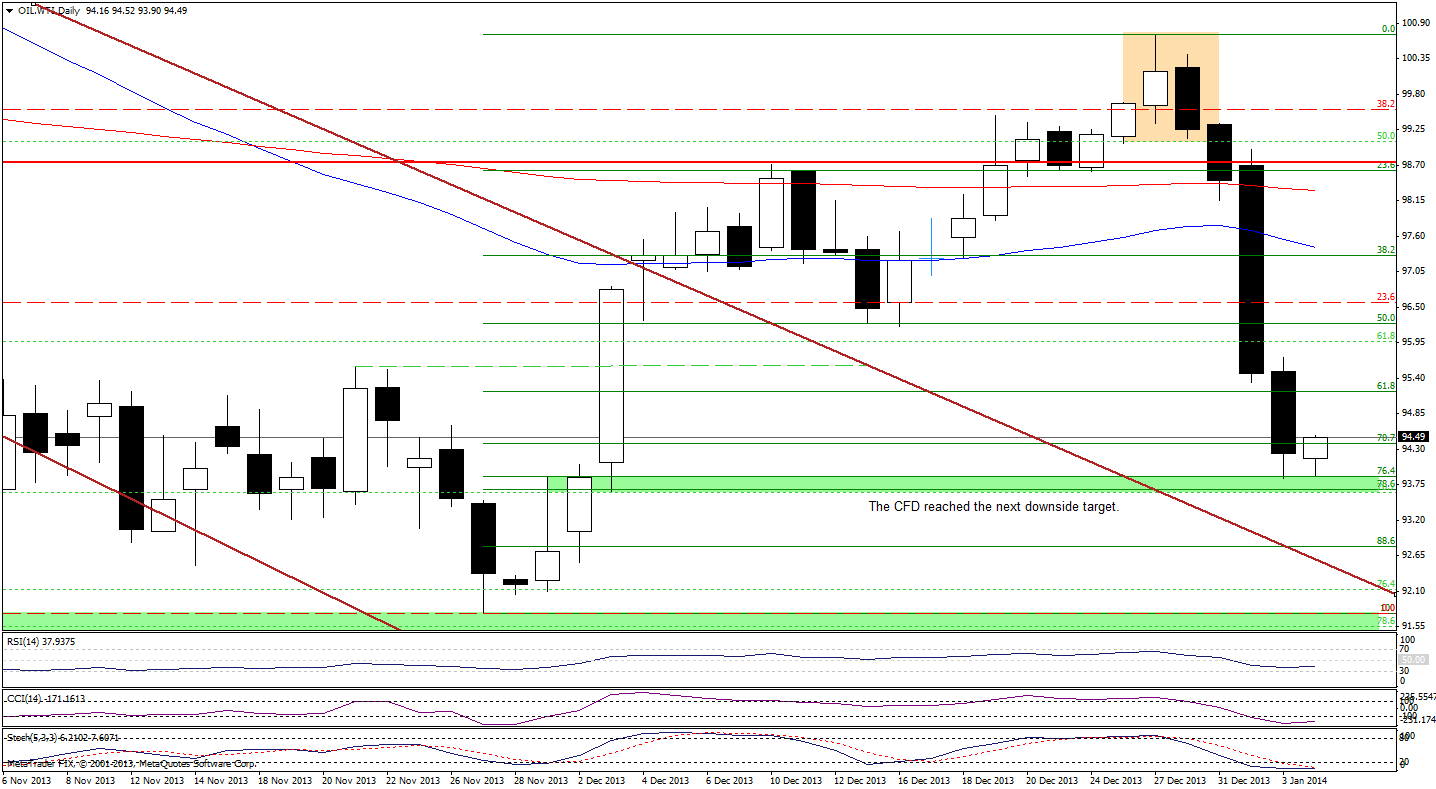
(…) similarly to what we wrote in the case of crude oil (…) if the buyers fail and the CFD drops below the 61.8% retracement, we will likely see further deterioration and the next downside target will be around $93.68-$93.88, where the Dec. 3 low intersects with the 78.6% Fibonacci retracement level.
On the above chart, we see that we had such price action on Friday. Despite a small upswing, oil bears quickly took control and pushed the CFD below the 61.8% retracement, which triggered further declines. With this downward move, WTI Crude Oil reached the downside target and hit a daily low of $93.85.
Earlier today, the CFD re-tested the strength of the monthly low and rebounded in the following hours, however, it’s too early to say that the worst is already behind oil bulls – especially when we factor in the position of the indicators. Although the RSI declined once again it still has some space for further drops. Additionally, the CCI and Stochastic Oscillator are oversold, but they didn’t generate buy signals yet.
Once we know the above, let’s take a look at the NYSE Arca Oil Index (XOI) chart.
Quoting our previous Oil Trading Alert:
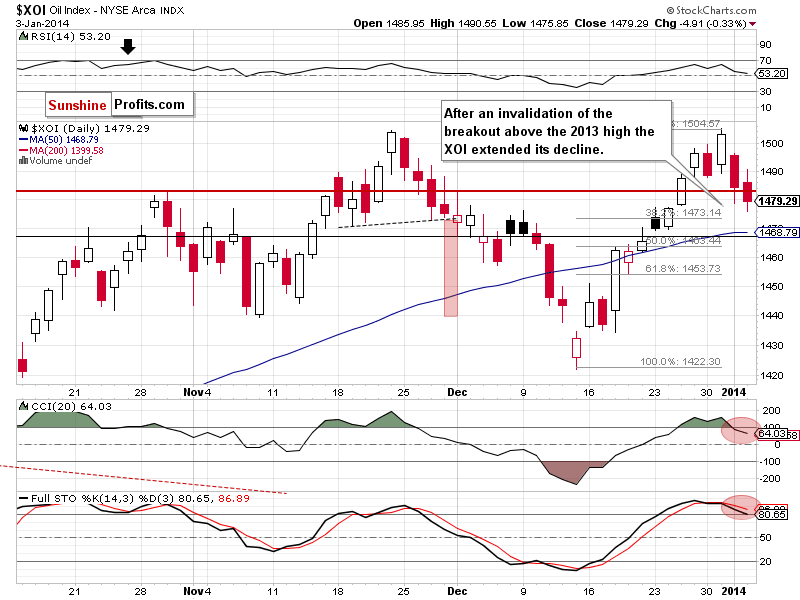
(...) the XOI invalidated small (actually a very small) breakout above the previous 2013 high, which is a bearish signal. On top of that, the CCI also generated a sell signal. From this perspective, an invalidation of the breakout in combination with the proximity to medium-term resistance line and sell signals generated by two indicators will likely result in further deterioration in the coming days.
On the above chart, we see that the XOI extended its decline on Friday and almost reached the 38.2% Fibonacci retracement level based on the recent rally. Therefore, if this support encourages buyers to push the buy button, we will likely see a corrective move up. On the other hand, if they fail, we will likely see further declines and the next target for the sellers will be the support zone created by the 50-day moving average and the 50% Fibonacci retracement level (between 1,463 and 1,468).
Summing up, on Friday crude oil reached the short-term declining support line, which successfully stopped declines in December. As mentioned earlier, with this downward move crude oil also reached the 76.4% Fibonacci retracement level and the medium-term rising support line, which is also the lower border of the rising trend channel and successfully stopped further declines in the previous month. Connecting the dots, this strong support zone will likely encourage the buyers to act and we could see an upward correction in the near future. We are waiting to see a confirmation that the bottom is in, before suggesting going long, or an invalidation of the above-mentioned support lines (the medium- and short-term one) before we consider going short.
Very short-term outlook: bearish
Short-term outlook: bearish
MT outlook: mixed
LT outlook: mixed
Trading position (short-term): We do not suggest opening any positions at the moment. We will keep you informed should anything change, or should we see a confirmation/invalidation of the above.
Thank you.
Nadia Simmons
Forex & Oil Trading Strategist
Oil Investment Updates
Oil Trading Alerts

