
Trading position (short-term): In our opinion no positions are justified from the risk/reward perspective.
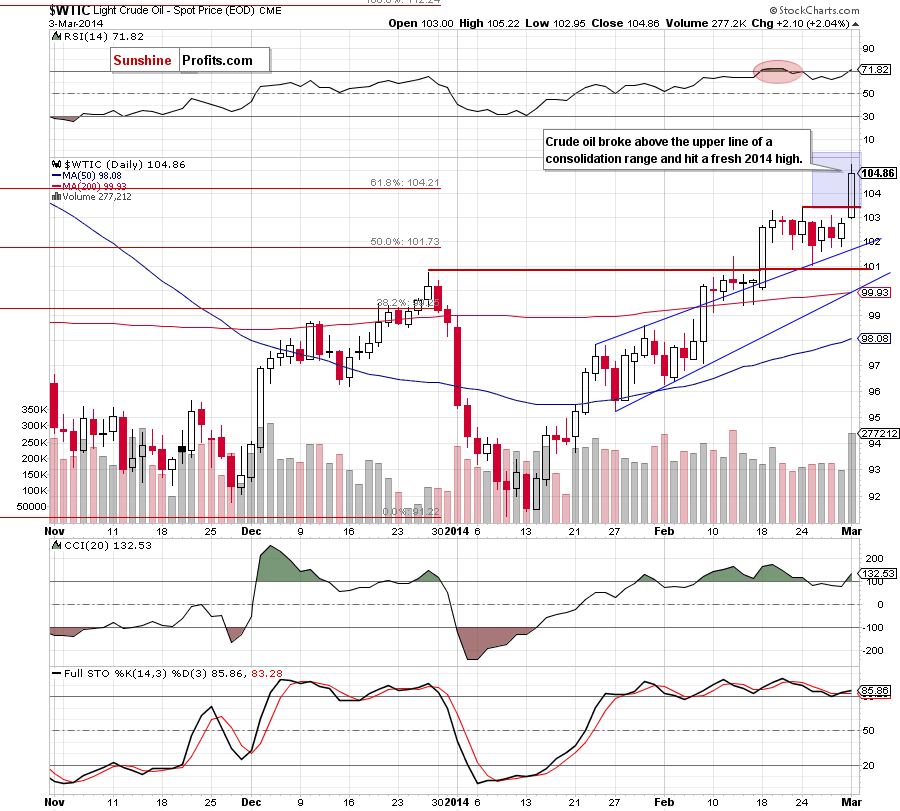
On Monday, crude oil gained 2.04% as positive U.S. economic data weighted on the price. In this way, light crude extended gains and broke above the February high, finishing the day slightly below $105 per barrel.
Yesterday, crude oil moved higher after positive U.S. economic data. The Commerce Department reported that personal spending rose 0.4% (above expectations for an increase of 0.1%) and personal income rose 0.3% (also above expectations for a 0.2% increase. Additionally, the core PCE price index rose 0.1% in line with expectations. Later in the day, the price of light crude was also supported by the data from the Institute for Supply Management, which reported that its manufacturing purchasing managers’ index rose to 53.2 last month from 51.3 in January (well above expectations for a reading of 52.0.
These stronger-than-expected data fueled expectations that the U.S. economy will continue to recover and will demand more fuel and energy. In reaction to this, as mentioned earlier, light crude extended gains and hit a fresh 2014 high of $105.22.
Having discussed the above, let’s move on to the technical changes in the crude oil market (charts courtesy of http://stockcharts.com.)
Quoting our previous Oil Trading Alert:
(…) it seems that as long as there is no breakout above the monthly high (or a breakdown below the upper line of the rising trend channel) a bigger upswing (or downswing) is not likely to be seen.(…) Please note that if crude oil climbs once again, the upside target for the buyers will likely be the 61.8% Fibonacci retracement level (around $104.20).
As you see on the above chart, crude oil extended gains and broke above the upper line of a consolidation range between the monthly high and the upper line of the rising trend channel. With this upswing, the price also climbed above the 127.2% Fibonacci extension level (based on the Dec.-Jan. decline), which triggered further improvement and took light crude above the 61.8% Fibonacci retracement. From this perspective, we see that yesterday’s increase materialized on large volume, which confirms the strength of the buyers at the moment. If oil bulls do not give up, we may see another attempt to move higher and the next upside target would be around $106, where the 70.7% Fibonacci retracement is (slightly below this level is also the price target after a breakout from the consolidation range and we marked it with a light blue rectangle). However, if they fail, the price of light crude may reverse and the first support level would be the previously-broken February high.
Having discussed the current situation in light crude, let’s take a look at WTI Crude Oil (the CFD).
In our previous Oil Trading Alert, we wrote the following:
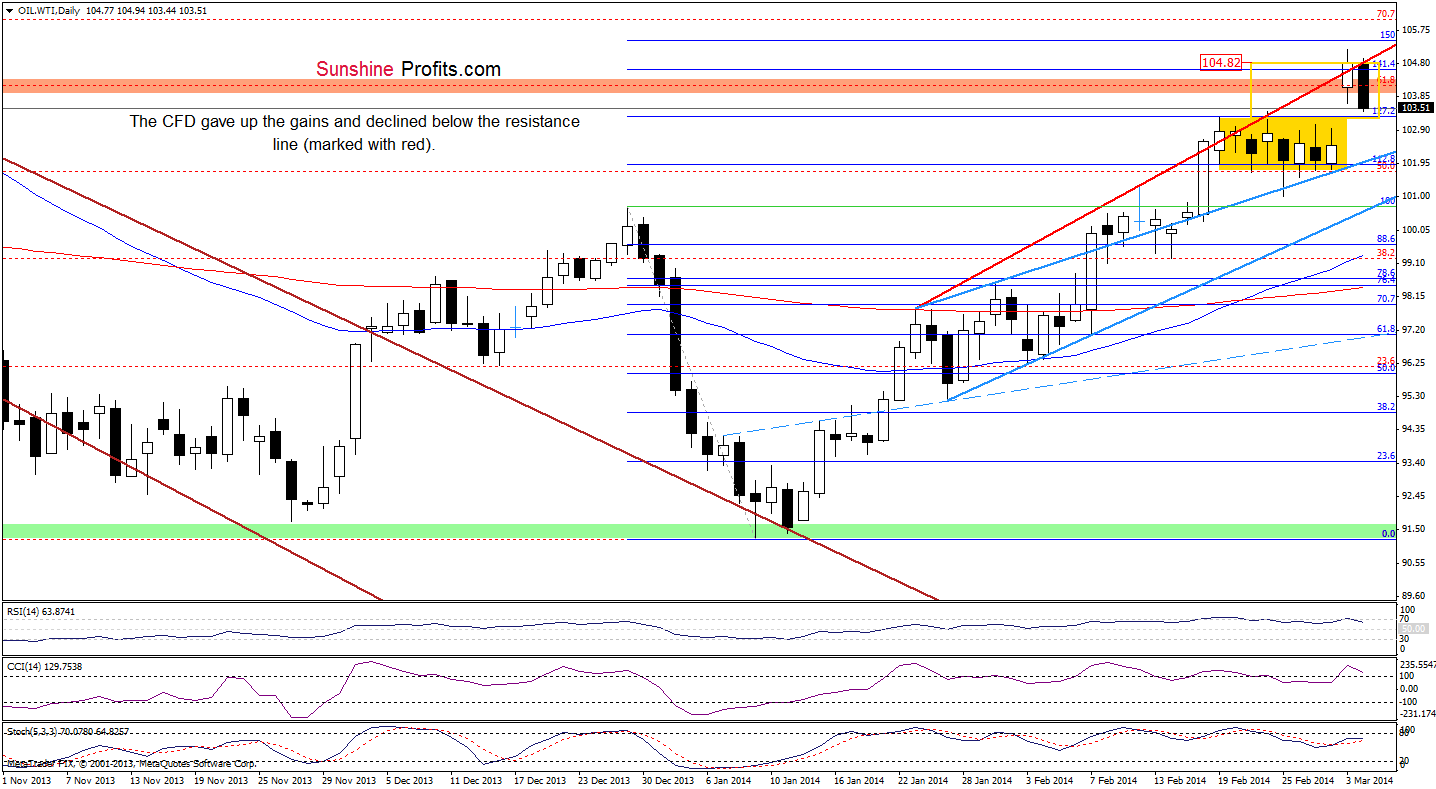
(…) WTI Crude Oil opened the week above the upper border of a consolidation range. According to theory, such price action should trigger a pro growth scenario, which assumes an increase to around $104.82 (…) the CFD (…) climbed to the very short-term rising line (marked with red) based on the Jan.23 and Feb.12 high, which together with the 141.4% Fibonacci extension serves as the nearest resistance. If this area encourages oil bears to act, we will likely see a comeback to the consolidation range. However, if it is broken, the CFD may increase to around $105.44 (where the next Fibonacci extension is) or even slightly above $106.04 (the 70.7% Fibonacci retracement based on the entire Aug.-Jan. decline). Please note that the current position of the indicators support the bullish case (although the RSI and CCI are overbought, the Stochastic Oscillator generated a buy signal).
Yesterday, we noticed such price action as oil bulls managed to push the CFD to its first upside target. Thanks to this upswing, WTI Crude Oil hit a fresh 2014 high of $105.20, broke above the very short-term rising line and the 141.4% Fibonacci extension. However, as it turned out, this improvement was only temporary and the CFD invalidated these breakouts earlier today, which is a bearish signal. If this encourage oil bears to act, we will likely see further deterioration and a comeback to the consolidation range. At this point, it’s worth noting that the RSI declined below the level of 70 generating a sell signal, which suggests that a pause or a pullback is just around the corner.
Summing up, the very short-term outlook for crude oil improved significantly as crude oil broke above the February high and the 61.8% Fibonacci retracement level, hitting the fresh 2014 high. As mentioned earlier, this upswing materialized on large volume, which confirms the strength of the buyers, suggesting further improvement. However, taking into account the current situation in the CFD (the sell signal generated by the RSI, while other indicators are close to doing it), it seems that we may see a pause or a pullback in the nearest future. Please note that this scenario will be more likely, if the CFD closes a gap between yesterday low and Friday high and returns to the consolidation range.
Very short-term outlook: bullish
Short-term outlook: bullish
MT outlook: bullish
LT outlook: mixed
Trading position (short-term): In our opinion, although the situation has improved, opening long positions at the moment is not a good idea as the space for further growth seems limited. On the other hand, as long as there is no an invalidation of a breakout above the previous high, the situation will be not bearish enough to justify opening short positions. We will keep you informed should anything change, or should we see a confirmation/invalidation of the above.
Thank you.
Nadia Simmons
Forex & Oil Trading Strategist
Forex Trading Alerts
Oil Investment Updates
Oil Trading Alerts

