
Trading position (short-term): In our opinion no positions are justified from the risk/reward perspective.
On Monday, crude oil extended gains and hit a fresh six-week high before pulling back on forecasts for slightly warmer weather. Thanks to this news, light crude lost 0.17% and closed the day at the psychological barrier of $100 per barrel.
At the end of January (and also in early February), the price of light crude rose as colder-than-normal temperatures boosted demand for heating fuel and other distillates, which resulted in an over 12% lower distillate stockpiles than a year earlier. Therefore, forecasts for moderating temperatures in the coming weeks capped gains yesterday. A report from MDA Weather Services showed that the cold will stick around in the short term, but will eventually give way to a warmer period for the central and eastern states within two weeks. Thanks to this news, crude oil gave up the gains and declined to $100 per barrel.
Please note that market participants are awaiting Federal Reserve Chairman Janet Yellen's testimony on the bank’s semiannual monetary policy report later in the day, hoping she will shed insight on the direction of the U.S. central bank's $65 billion in monthly bond purchases.
Having discussed the above, let’s move on to the technical changes in the crude oil market (charts courtesy of http://stockcharts.com.)
Quoting our last Oil Trading Alert:
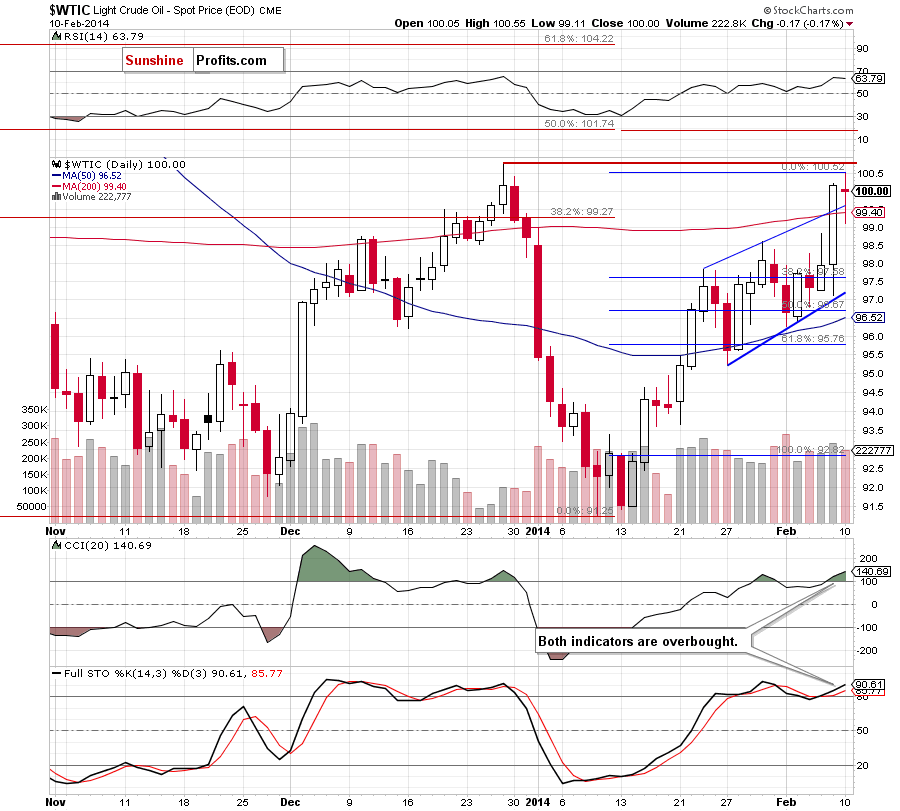
(…) we should keep in mind that although crude oil climbed above $100, it still remains below the December high, which serves as the nearest resistance at the moment. Additionally, when we take a closer look at the indicators, we see that there are negative divergences between the CCI, Stochastic Oscillator and light crude. On top of that, both indicators are overbought, which suggests caution.
Looking at the above chart, we see that the situation has improved after the market open as crude oil extended gains and hit a fresh monthly high of $100.55. Despite this increase, a resistance level created by the December high encouraged oil bears to act and triggered a pullback. In this way, light crude gave up the gains and declined very temporary below the previously-broken strong resistance zone (created by the 200-day moving average, the 38.2% Fibonacci retracement level based on the entire Aug.-Jan. decline and the upper border of the rising trend channel). However, this area (which serves as support at the moment) encouraged oil bulls to act and crude oil rebounded.
From this perspective, we should consider two scenarios. On one hand, if the breakout above the upper border of the rising trend channel is not invalidated and crude oil increases above the December high, we may see further improvement and the upside target would be the 50% Fibonacci retracement. On the other hand, if light crude invalidates the breakout, we will likely see a bigger pullback and the downside target will be the lower border of the rising trend channel (currently slightly above $97). Please note that the CCI and Stochastic Oscillator are overbought, which suggests that a correction is just around the corner.
Having discussed the current situation in light crude, let’s take a look at WTI Crude Oil (the CFD).
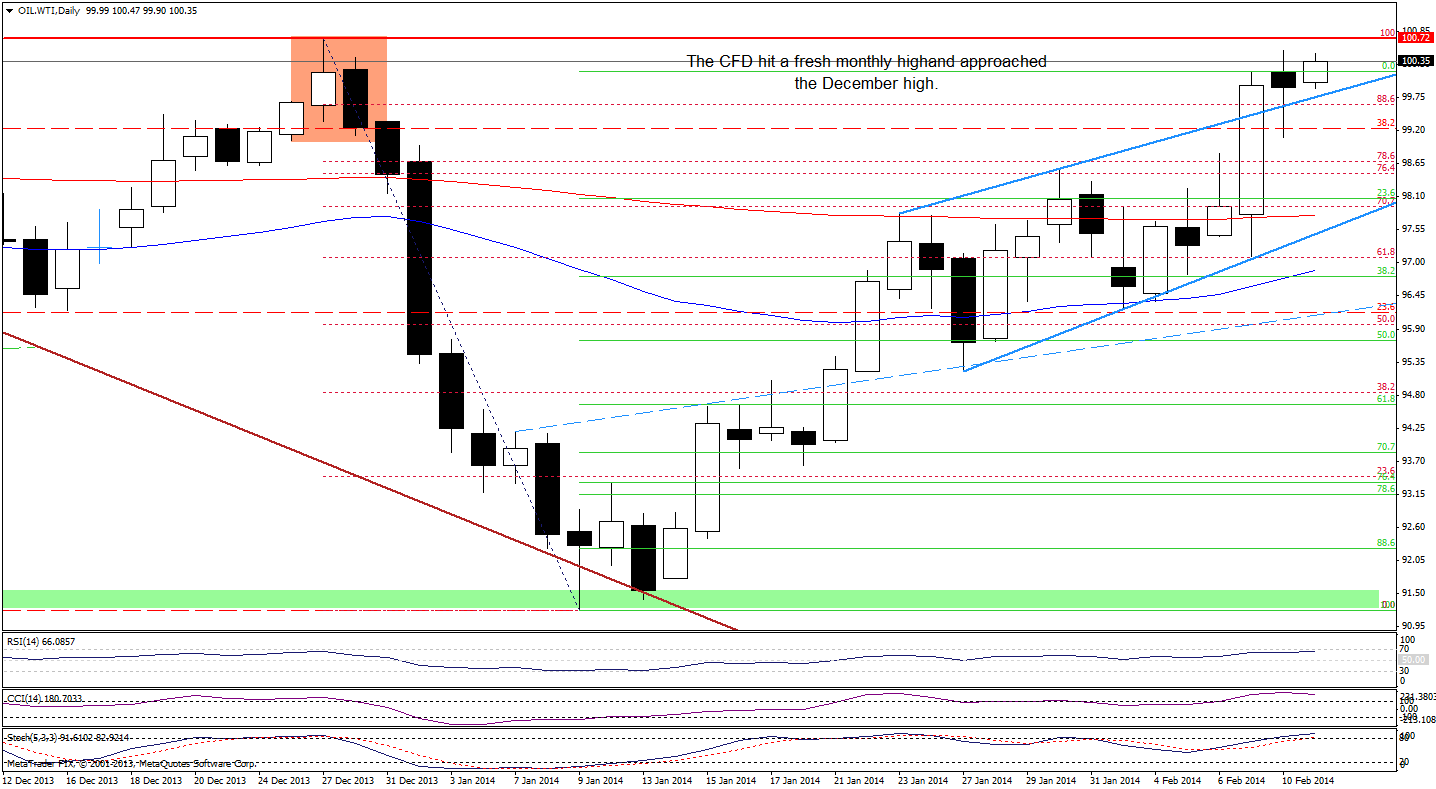
Looking at the above chart, we see that although WTI Crude Oil declined very temporary below the upper border of the rising trend channel, the CFD rebounded quickly. Additionally, we saw further improvement earlier today as the price increased to $100.47 (slightly below yesterday’s high of $100.52). Nevertheless, the overall situation hasn’t changed much as the CFD remains between the upper border of the rising trend channel and the December high (which is reinforced by a bearish engulfing candlestick pattern). Therefore, what we wrote in our last Oil Trading Alert remains up-to-date also today.
(…) we saw first attempt to invalidate the breakout above the upper border of the rising trend channel. If the buyers fail and the CFD closes the day below this support line, it will be a strong bearish signal that will likely trigger further deterioration. At this point it’s worth noting that the CCI and Stochastic Oscillator are overbought, which may encourages sellers to act. Nevertheless, as long as WTI Crude Oil remains above the upper border of the rising trend channel, another attempt to move higher can’t be ruled out.
Summing up, although the situation has improved temporarily, crude oil gave up the gains and closed the day at the psychological barrier of $100. As mentioned earlier, we should consider two scenarios. On one hand, if the breakout above the upper border of the rising trend channel is not invalidated and crude oil increases above the December high, we may see further improvement and the upside target would be the 50% Fibonacci retracement. On the other hand, if light crude invalidates the breakout, we will likely see a bigger pullback and the downside target will be the lower border of the rising trend channel (currently slightly above $97). The CCI and Stochastic Oscillator are overbought, which suggests that a correction is just around the corner.
Very short-term outlook: bullish
Short-term outlook: bullish
MT outlook: bullish
LT outlook: mixed
Trading position (short-term): In our opinion, there were no changes in crude oil that justify opening short or long positions at the moment. We will keep you informed should anything change, or should we see a confirmation/invalidation of the above.
Thank you.
Nadia Simmons
Forex & Oil Trading Strategist
Forex Trading Alerts
Oil Investment Updates
Oil Trading Alerts

