
Trading position (short-term): In our opinion no positions are justified from the risk/reward perspective.
On Monday, crude oil erased Friday’s losses and gained 0.51% as expectations of strong demand for heating fuels refined from crude oil and supply concerns pushed the price higher. Thanks to these circumstances, light crude hit a 20-week high of $103.45 per barrel.
Yesterday, the U.S. National Weather service said that frosty arctic air will return to the central and eastern U.S as two storms threaten to bring snow to the Northeast, fueling expectations of strong demand for heating oil. As a reminder, colder-than-normal temperatures and winter storms have driven strong demand for heating-related fuels such as heating oil recently, pushing the price of light crude higher. Therefore, yesterday’s weather forecasts also had a positive impact on crude oil.
Additionally, global supply concerns pushed light crude to a new 2014 high. According to National Oil Corp., Libyan oil output fell to 230,000 barrels a day (down from 570,000 barrels a day in early January) as labor unrest has limited Libyan oil production and exports. At this point it’s worth noting that market participants are also concerned about supply reductions in Nigeria, Venezuela and South Sudan, which is also a bullish factor supporting the commodity.
Having discussed the above, let’s move on to the technical changes in the crude oil market (charts courtesy of http://stockcharts.com.)

As you see on the daily chart, although crude oil moved higher and hit a fresh monthly high, the situation hasn’t changed much as light crude came back to a consolidation range between Wednesday high and low (marked with a light blue rectangle). From this point of view, what we wrote in our last Oil Trading Alert remains up-to-date.
(…) we should keep in mind that crude oil still remains below the 127.2% Fibonacci extension level based on the Dec.-Jan. decline (around $103.34), which serves as the nearest resistance level. If it encourages oil bears to act, we may see further deterioration in the coming day (or days). In this case the first downside target for the sellers would be a support zone created by the December peak, (…) and the upper line of the rising trend channel. It’s worth mentioning that his scenario is reinforced by the current position of the indicators, which are overbought. More importantly, the RSI declined below the level of 70, generating a sell signal (we saw similar situation in the case of the Stochastic Oscillator, but it still remains above the level of 80), which suggests that a pause or a correction is likely to be seen in the near future. Please note that even if crude oil climbs once again, it seems that the space for further growth will be likely limited by the 61.8% Fibonacci retracement level.
Additionally, when we take a closer look at the daily chart, we notice that yesterday’s upswing materialized on relative low volume, which doesn’t confirm the strength of the buyers and suggests that a bearish scenario is just around the corner.
Having discussed the current situation in light crude, let’s take a look at WTI Crude Oil (the CFD).
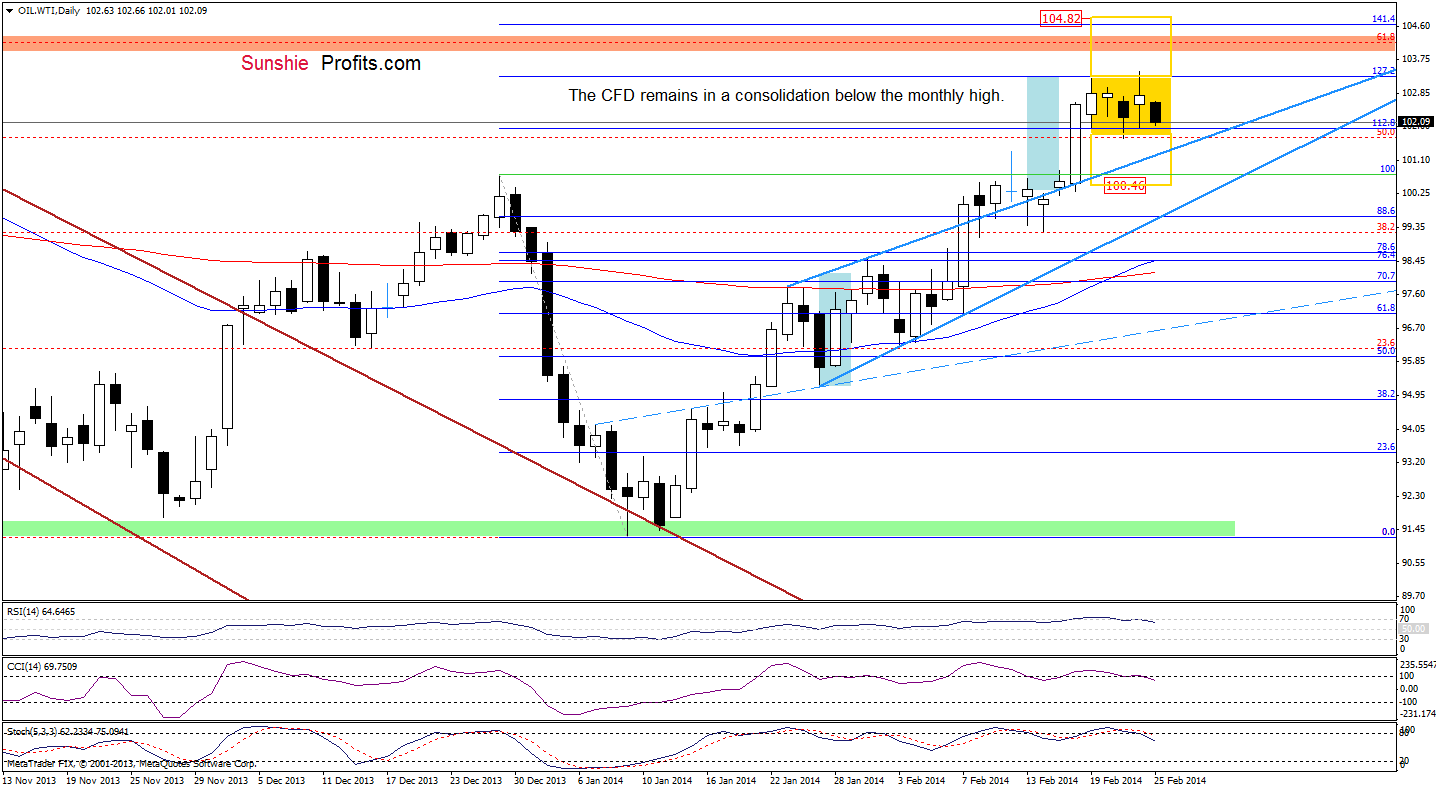
Looking at the above chart, we see that the CFD hit a fresh February high yesterday. Despite this (very temporary) improvement, the situation hasn’t changed much as WTI Crude Oil came back to a consolidation slightly below the monthly high. From this perspective, we see that the 127.2% Fibonacci extension level (based on the Dec.-Jan. decline) is still in play and serves as the nearest resistance level. Therefore, what we wrote in our previous Oil Trading Alert is also up-to-date.
(…) if this strong resistance encourages sellers to act, we will likely see a pullback in the coming day (or days) and the first important support will be the previously-broken upper border of the rising trend channel/rising wedge. However, if the CFD declines below the lower border of the consolidation range, the price target for the pattern will be around $100.46, slightly above the Feb.18 low. This scenario is currently reinforced by the position of the indicators – they all generated sell signals earlier today, which provides us with bearish implications.
Summing up, the current situation in crude oil hasn’t changed much as light crude came back to the consolidation range below the 127.2% Fibonacci extension level, which is a strong resistance level. As mentioned earlier, all indicators are overbought, which suggests that a pause or a pullback is just around the corner. This scenario is also reinforced by the current situation in the CFD (sell signals generated by the indicators remain in place, supporting the bearish case).
Very short-term outlook: mixed
Short-term outlook: bullish
MT outlook: bullish
LT outlook: mixed
Trading position (short-term): In our opinion, opening long positions at the moment is not a good idea as the space for further growth seems limited and the position of the indicators suggests that we may see a correction in the coming days. On the other hand, as long as there is no an invalidation of the breakout above the upper line of the rising trend channel (and light crude remains above the December high), the situation will not be bearish enough to justify opening short positions. We will keep you informed should anything change, or should we see a confirmation/invalidation of the above.
Thank you.
Nadia Simmons
Forex & Oil Trading Strategist
Forex Trading Alerts
Oil Investment Updates
Oil Trading Alerts

