
Trading position (short-term): In our opinion no positions are justified from the risk/reward perspective.
On Tuesday, crude oil gained 2.74% as weaker-than-expected U.S. data, expectations of strong demand for heating fuels and supply concerns pushed the price higher. Thanks to these circumstances, light crude climbed above $103 per barrel and hit a fresh 4-month high.
Yesterday, the U.S. dollar declined against major currencies after the New York Federal Reserve's Empire State index of manufacturing activity for February dropped to 4.48 this month from a 20-month high of 12.51 in January (while analysts had expected the index to decline to 9.00). Additionally, the new orders index fell to zero from a two-year high of 11 last month. These weaker-than-expected numbers pushed the greenback lower and supported crude oil, making it cheaper for holders of other currencies.
On top of that, newly updated weather forecasts released yesterday project another cold blast across much of the northern U.S. at the end of the month and through the beginning of March, revising away from previous forecasts predicting a sustained warming trend. These new weather forecasts fueled expectations of more demand for heating products. Please note that distillate inventories, which include heating oil, are 22% below their usual level for this time of year.
Also yesterday, reports that protests in Libya have disrupted oil operations and news that South Sudanese rebels seized control of an oil-producing region in the country fueled supply concerns and bolstered the price of light crude.
Having discussed the above, let’s move on to the technical changes in the crude oil market (charts courtesy of http://stockcharts.com.)
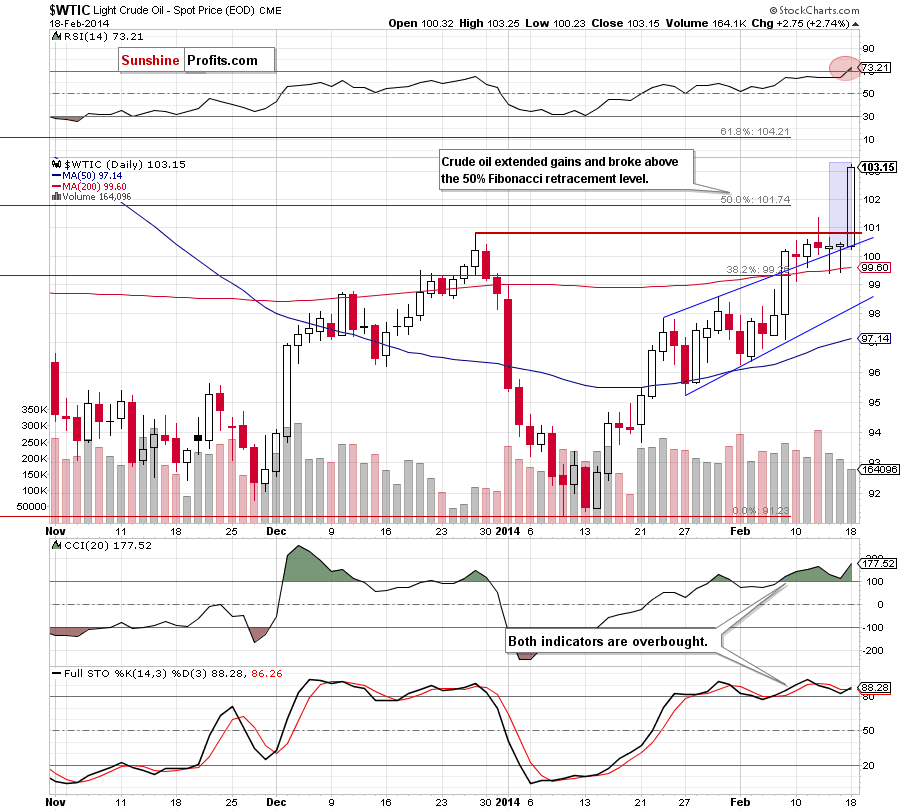
On the above chart, we see that the situation has improved significantly as crude oil bounced off the upper border of the rising trend channel and broke above the December high. With this increase light crude also moved above the previous February high and the 50% Fibonacci retracement level based on the entire Aug.-Jan. decline, which is a bullish sign. Unfortunately, this strong upswing materialized on relative low volume, which doesn’t confirm the strength of the buyers. Additionally, as you see on the daily chart, with this growth, crude oil reached its next upside target (marked with a light blue rectangle). At this point, it’s also worth noting that slightly above the current level is the 127.2% Fibonacci extension level (based on the Dec.-Jan. decline), which serves as resistance (around $103.34). On top of that, there is a negative divergence between the Stochastic Oscillator and crude oil, while the CCI and RSI are overbought. Taking all the above into account, it seems that a pause or a pullback is just around the corner.
Having discussed the current situation in light crude, let’s take a look at WTI Crude Oil (the CFD).
In our last Oil Trading Alert, we wrote:
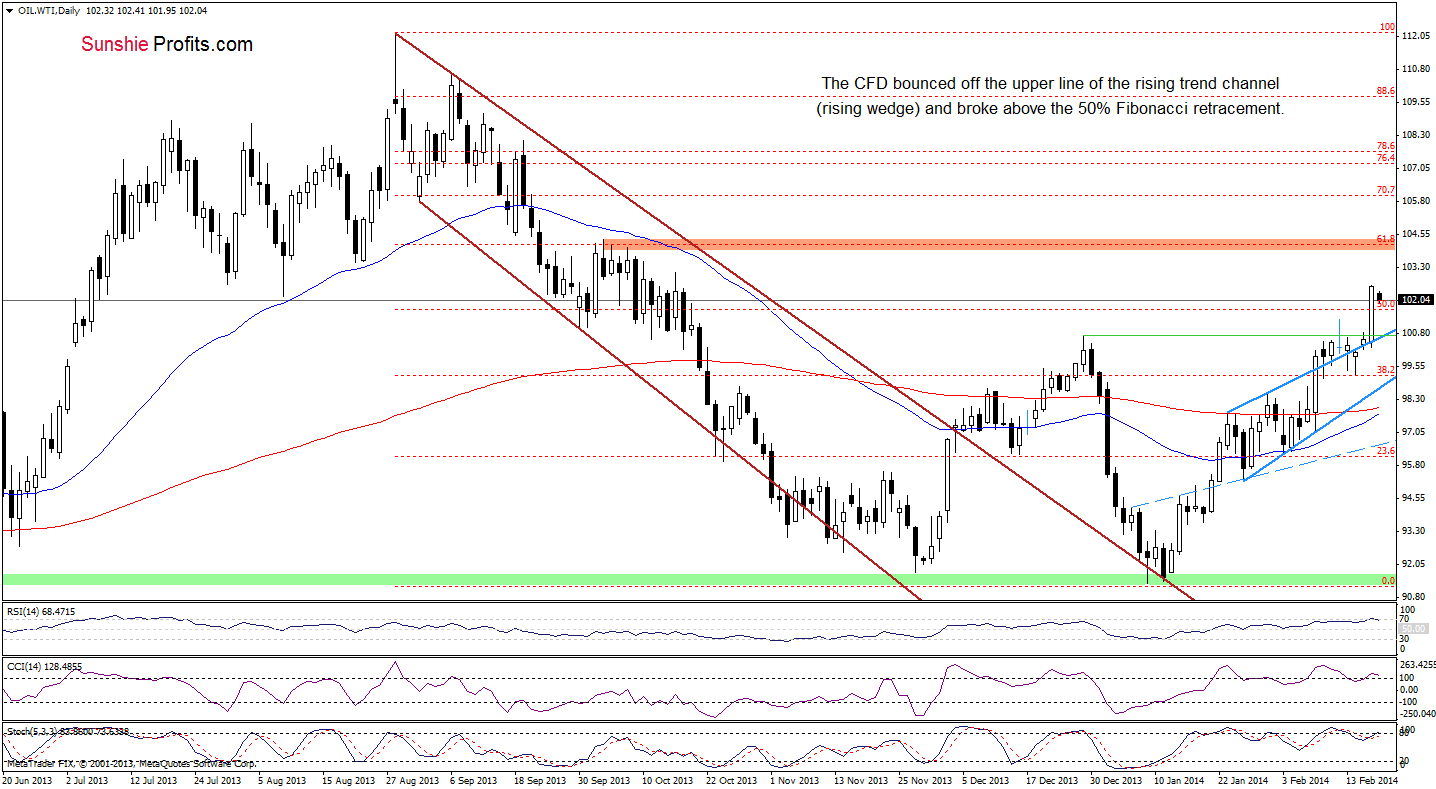
(…) although the CFD invalidated a breakdown below the upper border of the rising trend channel/rising wedge (which is a bullish signal), it still remains in a narrow range between this important support line and the February high. From this perspective, it seems that as long as there is no breakout above the monthly high (or a breakdown below the major support line), a bigger upswing (or downswing) is not likely to be seen.
Looking at the above chart, we see that an invalidation of the breakdown encouraged oil bulls to act and triggered a sharp upswing. With this growth, WTI Crude Oil bounced off the upper border of the rising trend channel/rising wedge and successfully broke not only above the December peak, but also above the February high. As you see on the daily chart, the CFD also climbed above its first upside target - the 50% Fibonacci retracement level based on the entire Aug-Jan. decline. From this perspective, the situation is bullish and the next target for the buyers is the 61.8% Fibonacci retracement, which corresponds to the October high. Nevertheless, we should keep in mind that there are negative divergences between the CCI, Stochastic Oscillator and the CFD. Additionally, the RSI reached the level of 70 (its highest level since December) and declined, which suggests that a pause or a pullback in the nearest future should not surprise us.
Summing up, the current situation in crude oil has improved significantly as light crude broke above the previous high and hit a fresh 4-month high. Nevertheless, we should keep in mind that yesterday’s sharp upswing materialized on relative low volume, which raises questions about the strength of the buyers. From today’s point of view, even if crude oil climbs once again, it seems that the space for further growth will be limited by the 61.8% Fibonacci retracement level – especially when we factor in negative divergence between the Stochastic Oscillator and crude oil (which are also visible in the case of the CFD) and the current position of the RSI. Please note that the indicator remains above the level of 70, which suggests that a pause or a pullback is just around the corner.
Very short-term outlook: bullish
Short-term outlook: bullish
MT outlook: bullish
LT outlook: mixed
Trading position (short-term): In our opinion, opening long positions at the moment is not a good idea as the space for further growth seems limited and the position of the indictors suggests that we may see a correction in the coming days. We will keep you informed should anything change, or should we see a confirmation/invalidation of the above.
Thank you.
Nadia Simmons
Forex & Oil Trading Strategist
Forex Trading Alerts
Oil Investment Updates
Oil Trading Alerts

