
Trading position (short-term): Long. Stop loss: $92.40.
On Wednesday, crude oil gained 1.56% as a new pipeline began transporting 300,000 barrels of crude oil a day, reducing the amount of U.S. oil stuck in storage. Thanks to this news, light crude climbed to its fresh 3-week high and closed the day well above $96 per barrel.
Yesterday, the southern leg of Keystone XL pipeline began transporting 300,000 barrels of crude oil a day, which bolstered expectations of reducing the storage glut in Oklahoma and pushed the price of light crude higher. The 487-mile, 36-inch pipeline is expected to carry an average of 520,000 barrels a day out of storage in Cushing, Okla., to oil refineries in the Houston area in its first year of operation.
Please note that the pipeline opening comes as market watchers expect that the Energy Information Administration (EIA) data will show that crude-oil storage supplies increased in the week ended Jan. 17 (analysts expect that oil inventories rose by 1.2 million barrels last week). If the estimate is correct, we may see a pause after the recent rally.
Having discussed the above, let’s move on to the technical changes in the crude oil market (charts courtesy of http://stockcharts.com.)
In our last Oil Trading Alert, we wrote the following:
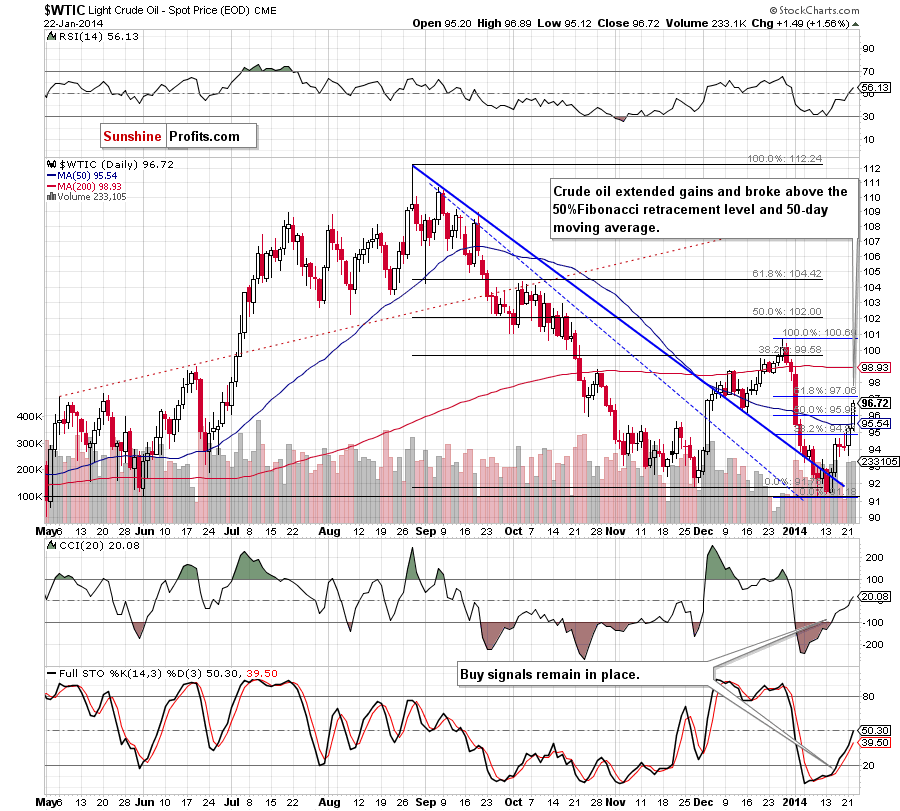
(…) crude oil rebounded sharply and broke above the 38.2% Fibonacci retracement level. What’s most important, this upswing materialized on large volume, which confirms the strength of the buyers and suggests that further improvement is likely to be seen in the coming day (or even days).
Looking at the above chart, we see that crude oil extended gains and broke not only above the 50-day moving average, but also above the 50% Fibonacci retracement level. Thanks to this upswing (which is confirmed by an increase in volume), light crude approached the next Fibonacci retracement (slightly above $97). If this strong resistance level encourages oil bears to act, we will likely see a corrective move in the near future. Please note that this potential correction will likely be limited by the 50-day moving average which serves as support. However, if it is broken, we will see further improvement and the next upside target will be around $97.96, where the next Fibonacci retracement level is. As a reminder, buy signals generated by the CCI and Stochastic Oscillator remain in place supporting oil bulls.
Having discussed the current situation in light crude, let’s take a look at WTI Crude Oil (the CFD).
Quoting our last Oil Trading Alert:
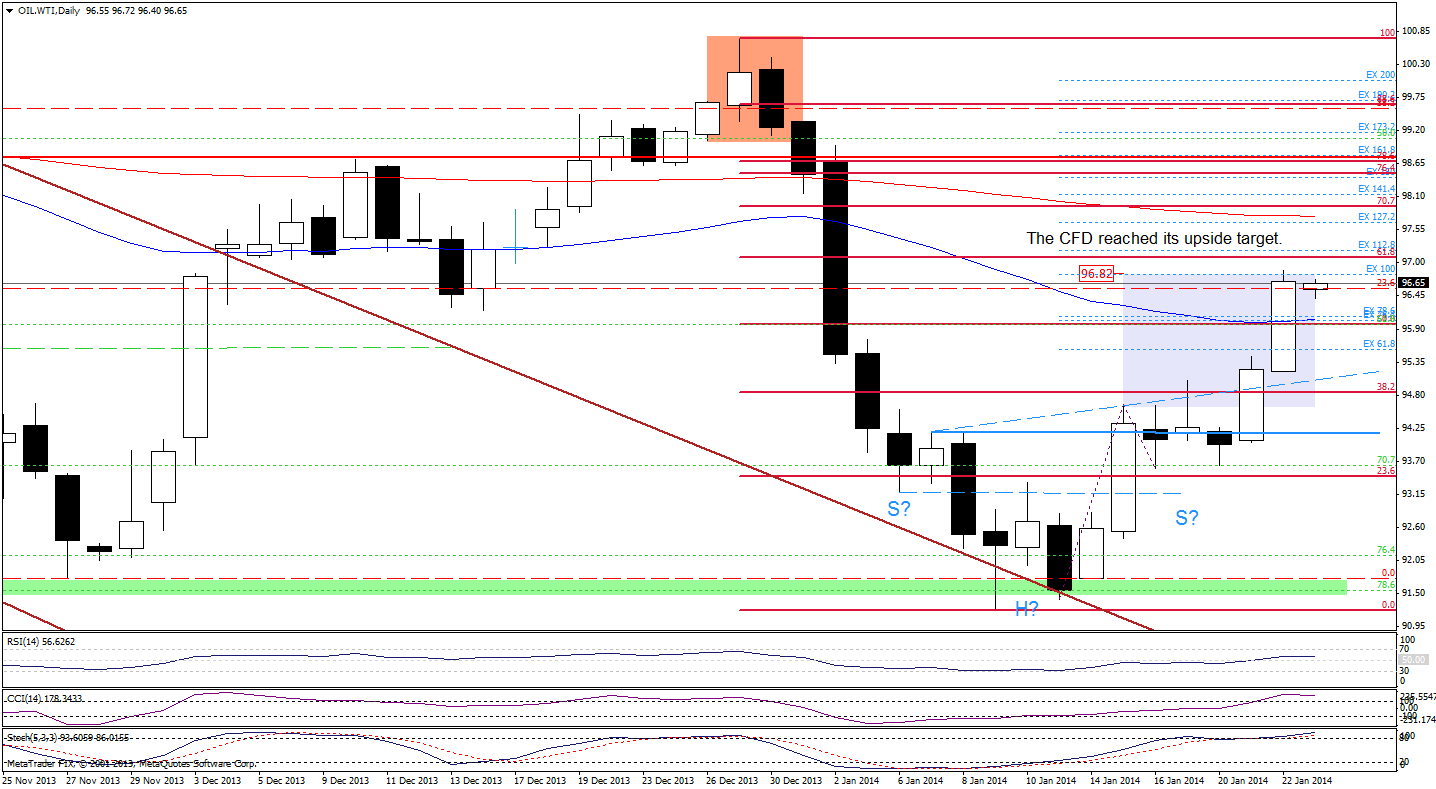
(…) WTI Crude Oil rebounded sharply (...) and not only erased the recent losses, but also broke above Friday’s high and the 38.2% Fibonacci retracement level. Thanks to this increase, the CFD also broke above the upper line of the consolidation range (…) the upside price target for this pattern will be around $96.76 (slightly below the 61.8% Fibonacci retracement).
When we factor in the Fibonacci price projections (based on the Jan. 13 and Jan.16 lows and the Jan. 15 high), we clearly see that the 100% projection intersects with the price target for the pattern, which suggests that further improvement is likely to be seen.
On the above chart, we see that WTI Crude Oil extended gains and reached its upside target (marked with the blue rectangle). With this upward move, the CFD broke above the 50-day moving average and approached the 61.8% Fibonacci retracement level. Just as we wrote in the case of crude oil, if this strong resistance level encourages oil bears to lock in gains, we will likely see a corrective move in the near future (but a decline will likely be limited by the 50-day moving average, which serves as support). However, if it is broken, we will see further improvement and the next upside target will be around $97.70, where the 200-day moving average and the 127.2% projection are (slightly below the 70.7% Fibonacci retracement level).
Looking at the position of the indicators, we see that the CCI and Stochastic Oscillator are overbought, but they didn’t generate sell signals and the RSI is not overbought, which supports the bullish case.
Summing up, crude oil extended gains and broke not only above the 50-day moving average, but also above the 50% Fibonacci retracement level. As mentioned earlier, this upswing materialized on large volume, which confirms the strength of the buyers and suggests that further improvement is likely to be seen in the coming days (a breakout above the 61.8% Fibonacci retracement level in the CFD would be an additional confirmation of this bullish scenario).
Very short-term outlook: bullish
Short-term outlook: bullish
MT outlook: bullish
LT outlook: mixed
Trading position (short-term): Long. Stop-loss order for this position: $92.40. Stop-loss order for WTI Crude Oil (CFD): $92.40. We will keep you informed should anything change, or should we see a confirmation/invalidation of the above.
Thank you.
Nadia Simmons
Forex & Oil Trading Strategist
Forex Trading Alerts
Oil Investment Updates
Oil Trading Alerts

