
On Thursday, crude oil fell to a four-month low of $95.95 as concerns over the U.S. economic outlook and its impact on future oil demand prospects dampened the appeal of the commodity. However, later in the day, the price reversed course and rose after Chinese output data beat expectations. Finally, light crude gained 0.10% and finished the day 10 cents above the Wednesday’s close.
Oil prices fell to the lowest levels of the session after preliminary data showed that U.S. manufacturing activity fell to a 12-month low of 51.1 in October from a reading of 52.8 in September. Additionally analysts had expected U.S. jobless claims to fall by 22,000 to 340,000 last week. Meanwhile, a separate report from the U.S. Department of Labor showed that the number of individuals filing for initial jobless benefits declined by 12,000 last week to a seasonally adjusted 350,000. The above (weaker than expected) numbers raised concerns over the U.S. economic outlook and the impact on future oil demand prospects.
As mentioned earlier, later in the day, the price of crude oil strengthened after data showed that China’s HSBC manufacturing index for October rose to a seven-month high of 50.9, up from a final reading of 50.2 in September. Economists had expected the index to tick up to 50.5. The measure remained above the 50.0-mark for the third consecutive month, indicating expansion in manufacturing activity. Please note that China is the world’s second-largest oil consuming nation and manufacturing numbers are used as indicators for future oil demand growth. Therefore, the above numbers sparked hopes that demand will strengthen in the Asian giant.
Having discussed the above, let’s move on to the technical changes in the crude oil market.
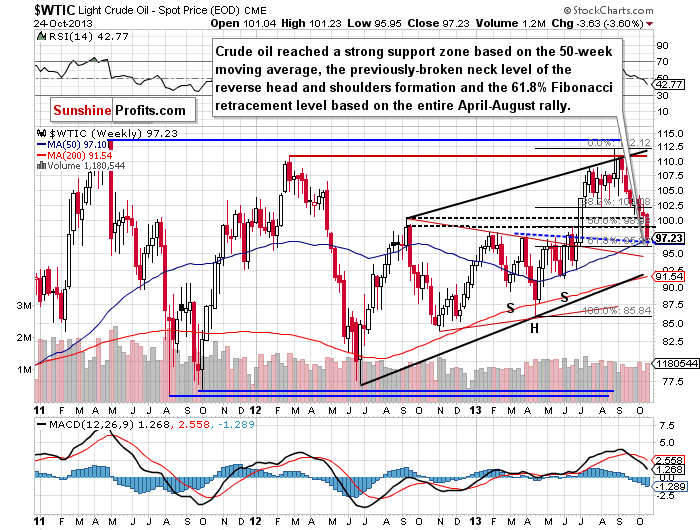
Yesterday, after the lower open, oil bears triggered another downward move, which took the price of light crude to a new monthly low of $95.95. In this way crude, oil slipped below the 61.8% Fibonacci retracement level based on the entire April-August rally. In spite of the fact, this important support level encouraged buyers to act and resulted in a pullback to a daily high of $97.69.
At this point, it’s worth mentioning that crude oil broke (only on an intraday basis) below a strong support zone based on the 50-week moving average and the previously-broken neck level of the reverse head and shoulders formation on Wednesday, but it closed the session slightly above this level. Yesterday we saw similar price action. Although light crude dropped to its new four-month low, in the following hours we saw a pullback and the Thursday’s session closed above this support once again. Therefore, the above-mentioned strong support zone still remains a major ally of the oil bulls.
Quoting our previous Oil Trading Alert:
(…) the daily RSI dropped to its lowest level since April. Back then, such a low value of the indicator had a positive impact on light crude. After the RSI moved to the 30 level, we saw a pullback in the following days. If history repeats itself, we may see similar price action in the near future.
Before we summarize, we want to focus on the XOI once again.
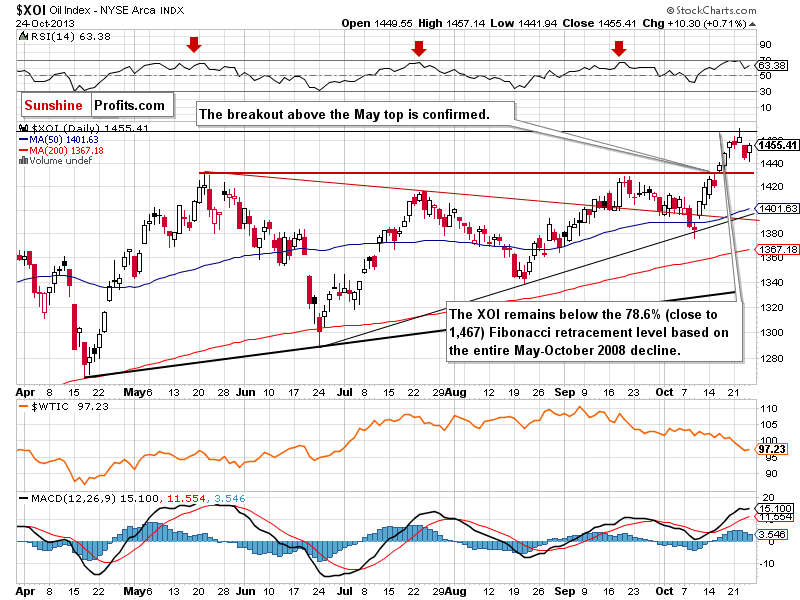
On Thursday, the oil stock index gained 0.71% and erased some of its earlier losses. Despite this growth, the XOI still remains below the 78.6% (close to 1,467) Fibonacci retracement level based on the entire May-October 2008 decline, which serves as strong resistance. Taking the above facts into account, it seems that we may see a double top pattern in the near future. However, if the buyers don’t give up and break above this resistance level, the rally will likely continue. In this case, the next target level will be around 1,560.
In our previous Oil Trading Alert we wrote that we may see further declines in oil stocks and a pullback in crude oil if the recent correlation between oil stocks and light crude remains in place. When we take a closer look at the daily charts and compare them, we notice that during the previous two days there was similar price action in crude oil and oil stocks. However, it seems that it’s too early to say if this is a reversal of the current tendency or just a temporary phenomenon.
Summing up, light crude bounced off the 61.8% Fibonacci retracement level based on the entire April-August rally and remains above a strong support zone based on the 50-week moving average and the previously-broken neck level of the reverse head and shoulders formation. Additionally, the daily RSI remains slightly above the 30 level. Taking all these facts into account we may see a pullback in the following days.
Very short-term outlook: bearish
Short-term outlook: bearish
MT outlook: mixed
LT outlook: bullish
Trading position (short-term): Although we are considering opening speculative short positions, we do not suggest opening them just yet. Taking into account the medium-term picture, the situation is still unclear.
Thank you.
Nadia Simmons
Sunshine Profits' Crude Oil Expert
Oil Investment Updates
Oil Trading Alerts

