
Trading position (short-term): no positions.
On Thursday, crude oil extended gains as the Commerce Department showed that the U.S. economy expanded 3.2% in the fourth quarter. Thanks to this news, light crude gained 0.62%, hit a 4-week high and closed the day above $98 per barrel.
Yesterday, the Commerce Department showed that gross domestic product (which is the broadest measure of goods and services produced across the economy) expanded 3.2% in the fourth quarter. The latest GDP figures show the economy expanded at a 3.7% pace in the second half of 2013, which was sharply higher than the 1.8% pace in the first half of the year. That marked the strongest second-half growth since 2003, when the economy expanded at a 5.8% pace.
Additionally, exports grew by 11.4% (after rising 3.9% in the third quarter), while federal consumption decreased, which bolstered hopes that the private sector will fuel more growth going forward. Yesterday’s data also showed that personal consumption grew 3.3% in the three months ended Dec. 31, which was the biggest increase in three years.
Taken together, the above data are a strong sign of economic improvement, which means stronger oil demand. Therefore, they fueled optimism among oil investors and encouraged them to push the price higher for a third straight session.
Having discussed the above, let’s move on to the technical changes in the crude oil market (charts courtesy of http://stockcharts.com.)
Quoting our last Oil Trading Alert:
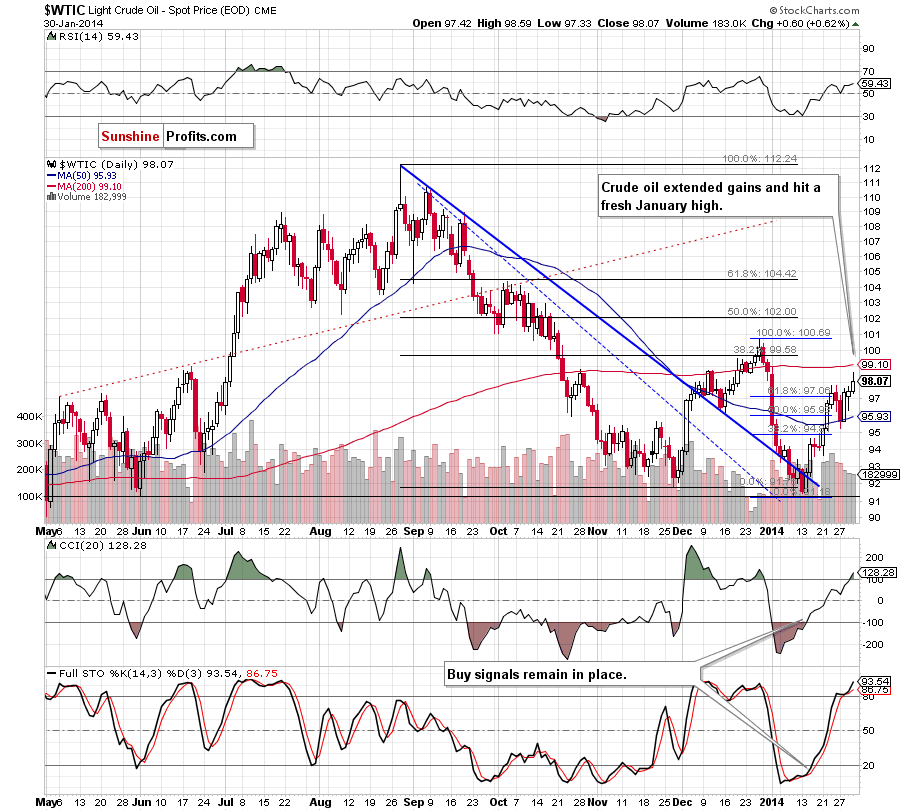
(…) taking into account the position of the indicators (buy signals remain in place supporting buyers), we may see another attempt to move higher. In this case, if oil bulls manage to push light crude above the Jan. 23 high, we will likely see further improvement and the upside target will be the 200-day moving average (currently at $99).
Looking at the above chart, we see that crude oil extended gains after a breakout above the Jan.23 high. With this upswing, light crude hit an intraday high of $98.59 and reached the 76.4% Fibonacci retracement level based on the recent decline. As you see on the daily chart, this resistance level (in combination with the proximity to the 200-day moving average) encouraged oil bears to trigger a small pullback. Despite this drop, crude oil still remains above the previous January high, which is a positive signal. Nevertheless, we should keep in mind that although buy signals remain in place, the CCI and Stochastic Oscillator are overbought. Additionally, yesterday’s upswing materialized on relatively low volume, which prescribe caution.
Before we discuss the current situation in the CFD, we would like to draw your attention to the crude oil weekly chart.
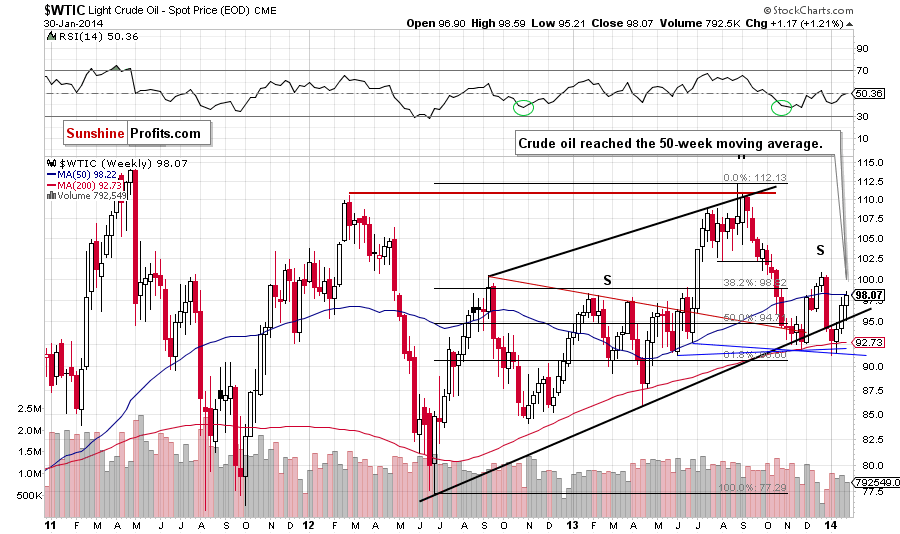
As you see on the above chart, light crude reached the 50-week moving average, which successfully paused further growth in early December. If history repeats itself once again, we may see similar price action in the coming week.
Having discussed the current situation in light crude, let’s take a look at WTI Crude Oil (the CFD).
Quoting our last Oil Trading Alert:
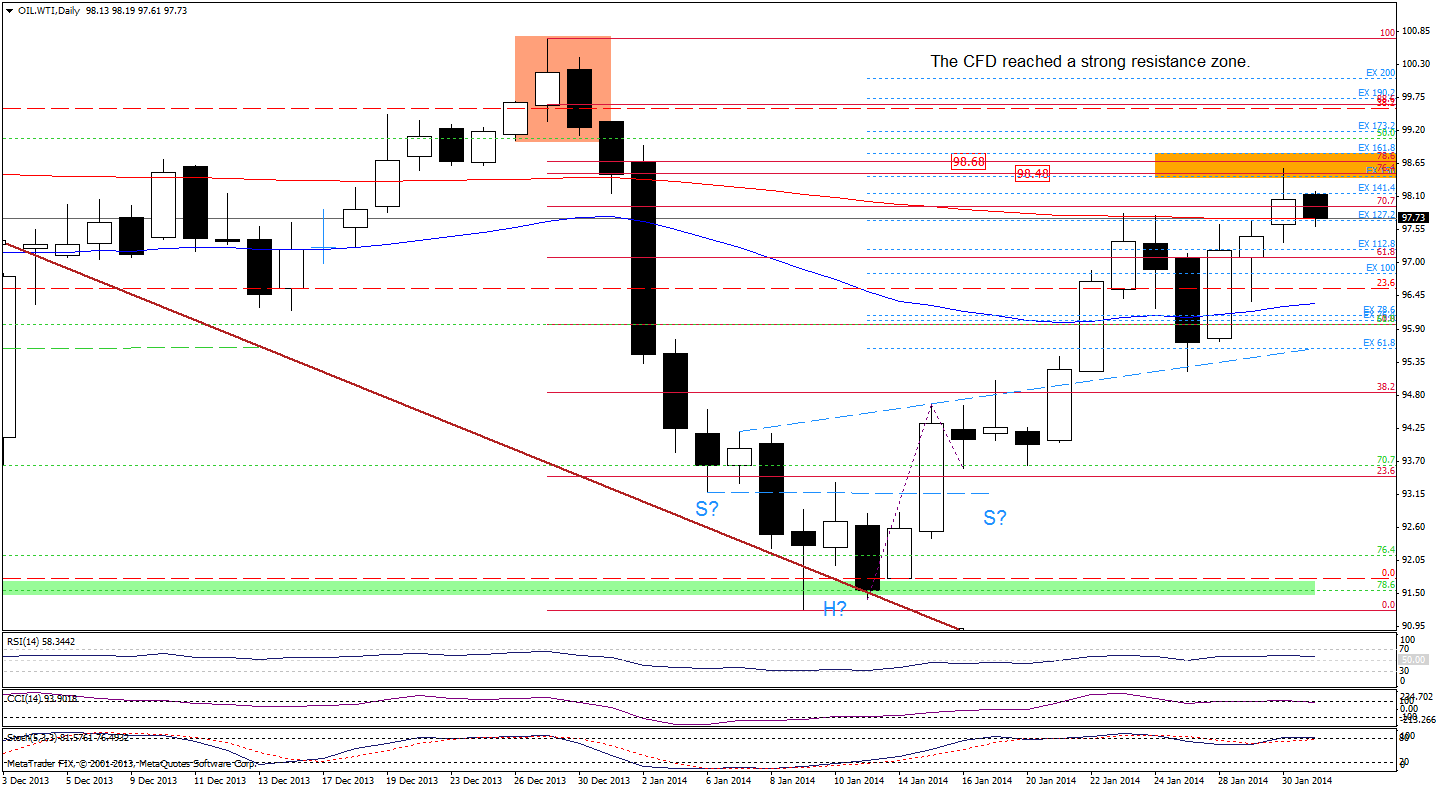
(…) oil bulls managed to push the CFD not only above the Jan.23 high, but also above the 200-day moving average and the 127.2% Fibonacci projection. This is a strong bullish signal and if the position of the indicators doesn’t encourage sellers to act, we will likely see further improvement. If this is the case, the upside price target will be around $98.47-$98.78 where the 76.4% and 78.6% Fibonacci retracements are.
On the above chart, we noticed that we saw such price action as WTI Crude Oil extended gains and reached its upside target. Please note that with this move, the CFD also reached the 150% Fibonacci projection. As you see on the daily chart, this strong resistance zone (created by the 76.4%, 78.6% Fibonacci retracements and the 150% projection) encouraged sellers to trigger a pullback earlier today. Although this correction is very sallow at the moment, the CFD reached the previously-broken 200-day moving average and the CCI generated a sell signal (while the Stochastic Oscillator is very close to doing it), which is not a positive sign. If this support is broken, we will likely see further deterioration and the first downside target will be the 50-day moving average (currently around $96.31).
Summing up, the situation has improved as crude oil extended gains and hit a 4-week high. However, as mentioned earlier, this upswing materialized on relatively low volume and the CCI and Stochastic Oscillators are overbought, which dictates caution. Additionally, with this upward move light crude reached the next Fibonacci retracement level and the 50-week moving average. Taking the above into account and combining with the current situation in the CFD (which declined to the previously-broken 200-day moving average after reaching the strong resistance zone), we can conclude that a bigger pullback is just around the corner.
Very short-term outlook: mixed
Short-term outlook: bullish
MT outlook: bullish
LT outlook: mixed
Trading position (short-term): We do not suggest opening any positions at the moment. We will keep you informed should anything change, or should we see a confirmation/invalidation of the above.
Thank you.
Nadia Simmons
Forex & Oil Trading Strategist
Forex Trading Alerts
Oil Investment Updates
Oil Trading Alerts

