
Trading position (short-term): In our opinion no positions are justified from the risk/reward perspective.
On Thursday, crude oil gained 0.65% as the U.S. dollar weakened against the euro and better-than-expected U.S. jobless claims pushed the price higher. In this way, light crude erased Wednesday losses and hit a one-month high of $98.83 per barrel.
Yesterday, the Labor Department showed that U.S. initial jobless claims fell by 20,000 to 331,000 from the previous week’s revised total of 351,000, while analysts had expected jobless claims to fall by 16,000. This bigger-than-expected drop boosted the price of light crude and helped erased earlier losses. Additionally, crude oil received a support after disappointing U.S. trade balance reading. Please note that yesterday’s data showed the U.S. trade deficit widened 12% to $38.7 billion in December, as exports dropped 2.2% and imports rose 1.6%.
On top of that, light crude extended gains after the euro increased against the U.S. dollar following dovish comments made by ECB President Mario Draghi after the ECB held its benchmark interest rate at a record low 0.25% (in line with expectations).
Please note that later in the day investors will receive highly anticipated U.S. nonfarm payrolls data. An unexpectedly low number could indicate lower oil demand, but an unexpectedly high number could prompt the Federal Reserve to pull back further on its bond purchases.
Having discussed the above, let’s move on to the technical changes in the crude oil market (charts courtesy of http://stockcharts.com.)
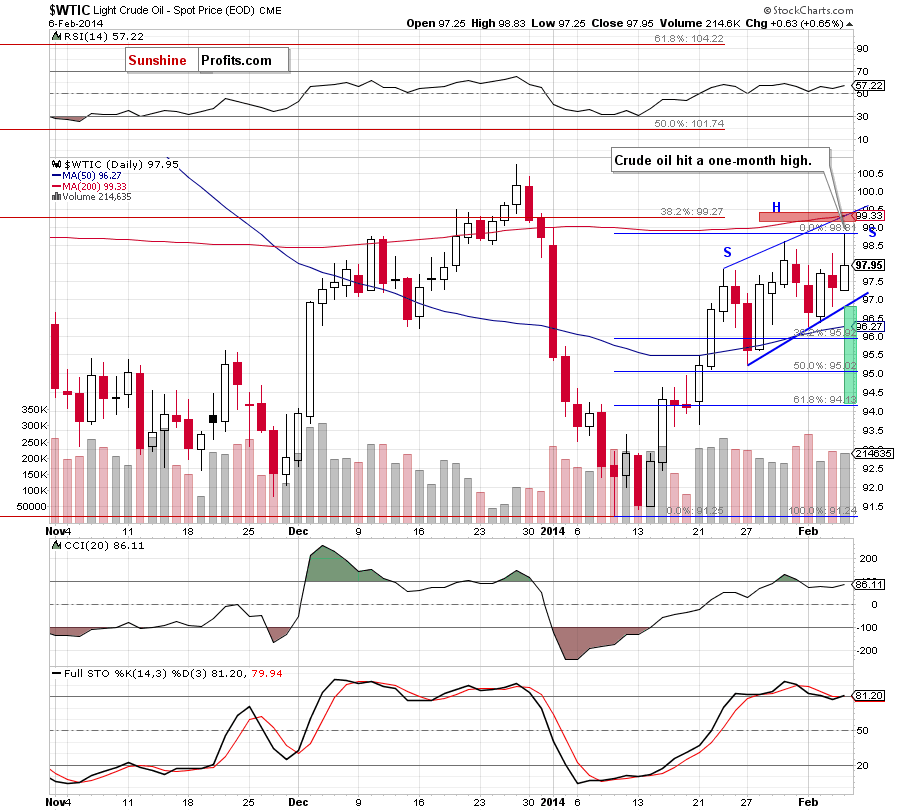
Looking at the above chart, we see that although crude oil moved higher after the market open and hit a one-month high of $98.83, the situation hasn’t changed much as the price quickly reversed and declined. As you see on the daily chart, despite yesterday’s increase, light crude still remains in a rising trend channel.
Taking this fact into account, it seems that as long as crude oil is trading in this area, further gains and declines seem limited. As a reminder, the upper line of the rising trend channel is reinforced by the 200-day moving average, which corresponds to the 38.2% Fibonacci retracement level based on the entire Aug.-Jan. decline (around $99.30). Meanwhile, the lower border of the trend channel is also the neck line of an unconfirmed head and shoulders formation.
From this perspective, what we wrote in our last Oil Trading Alert is still up-to-date.
(…) if the price drops below the neck line (…), we will likely see further deterioration and the downside price target for this pattern will be slightly above $94 where the 61.8% Fibonacci retracement level (based on the recent rally) is. However, we should keep in mind that the first support for crude oil will be the 50-day moving average (…). If it is broken, oil bulls will likely try to stop this corrective move around $95.90 where the 38.2% Fibonacci retracement is.
Please note that the position of the indicators still supports oil bears. Nevertheless, similarly to what we wrote yesterday, if today’s economic data encourage oil bulls once again, we may see another attempt to reach the upper line of the trend channel (as mentioned earlier, this is a very strong resistance zone, which will likely stop potential growth).
Having discussed the current situation in light crude, let’s take a look at WTI Crude Oil (the CFD).
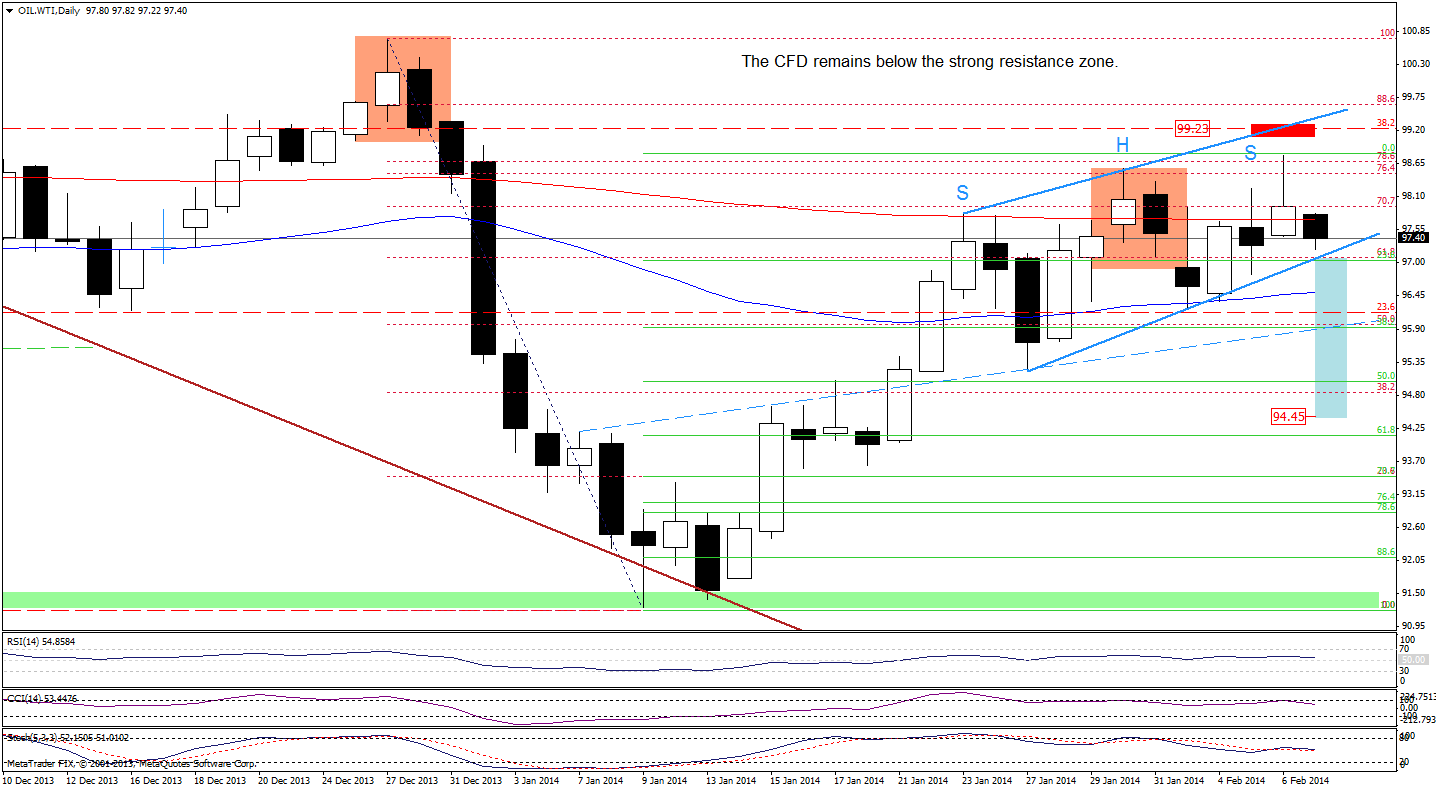
Looking at the above chart, we see that the CFD extended gains and hit a fresh monthly high of $98.81. With this upswing, WTI Crude Oil broke not only above the previous high, but also above the 78.6% Fibonacci retracement level. Despite this growth, the proximity to the strong resistance zone created by 38.2% Fibonacci retracement level based on the entire Aug.-Jan. decline, the upper blue line (which is also the upper border of the rising trend channel) and the 173.2% Fibonacci projection encouraged oil bears to act and resulted in a decline below the January high. Earlier today, we saw further deterioration as the CFD dropped below the 200-day moving average and approached the lower border of the rising trend channel. Taking this fact into account, what we wrote in our last Oil Trading Alert remains up-to-date.
(…) if the buyers fail and the CFD drops below the rising blue support line, we will likely see further deterioration. Additionally, if the 50-day moving average is broken, we will see a drop to (at least) the 38.2% Fibonacci retracement level based on the recent rally (which corresponds to the dashed blue support line at the moment) (…) we may see a head and shoulders formation. In this case, it’s quite possible that a potential correction will not stop at 38.2% Fibonacci retracement because the downside price target for this formation is slightly above $94.
Summing up, although crude oil hit a one-month high, this improvement was only temporary and, from today’s point of view, the current situation is a bit unclear. On one hand, if today’s economic data encourages oil bulls, we may see another attempt to reach the upper line of the trend channel. On the other hand, if oil bears show their claws and push crude oil below the lower border of the rising trend channel (which is also the neck line of the head and shoulders formation), we will likely see further deterioration and the downside price target for this pattern will be the 61.8% Fibonacci retracement level based on the recent rally (slightly above $94). Taking the above into account, we clearly see that as long as crude oil remains in a trend channel, further gains and declines are limited.
Very short-term outlook: mixed
Short-term outlook: bullish
MT outlook: bullish
LT outlook: mixed
Trading position (short-term): In our opinion, there were no significant changes in crude oil that justify opening short or long positions at the moment. We will keep you informed should anything change, or should we see a confirmation/invalidation of the above.
Thank you.
Nadia Simmons
Forex & Oil Trading Strategist
Forex Trading Alerts
Oil Investment Updates
Oil Trading Alerts

