
Trading position (short-term): In our opinion no positions are justified from the risk/reward perspective.
On Wednesday, crude oil climbed above $98 after the EIA data showed that crude inventories rose less than expected and better-than expected economic data. Despite this increase, light crude reversed and erased some of the gains later in the day.
Yesterday, the Institute for Supply Management showed that its services purchasing managers’ index increased to 54.0 in January from 53.0 in December, while analysts had expected the index to rise to 53.7. The better-than expected data eased concerns over a possible slowdown in U.S. recovery (after Monday’s ISM manufacturing index showed that activity dropped to a seven-month low in January) and had a positive impact on the price of light crude.
Also yesterday, the U.S. Energy Information Administration showed in its weekly report that U.S. crude oil inventories rose by 440,000 barrels in the week ended Jan. 31 (well below market expectations for an increase of over 2 million barrels) and distillate stockpiles declined by 2.4 million barrels (compared to market forecasts for a drop of 1.58 million). However, the smaller-than-expected rise could be attributed to a large drop in imports caused by inclement weather.
Before we focus on the technical side of the market, it’s worth noting that inventories in Cushing dropped by 1.5 million barrels to 40.3 million barrels to the lowest level since the week ended Dec. 27 (it was the first report that included an entire week in which the southern leg of TransCanada Corp.'s Keystone XL pipeline was in operation).
Having discussed the above, let’s move on to the technical changes in the crude oil market (charts courtesy of http://stockcharts.com.)
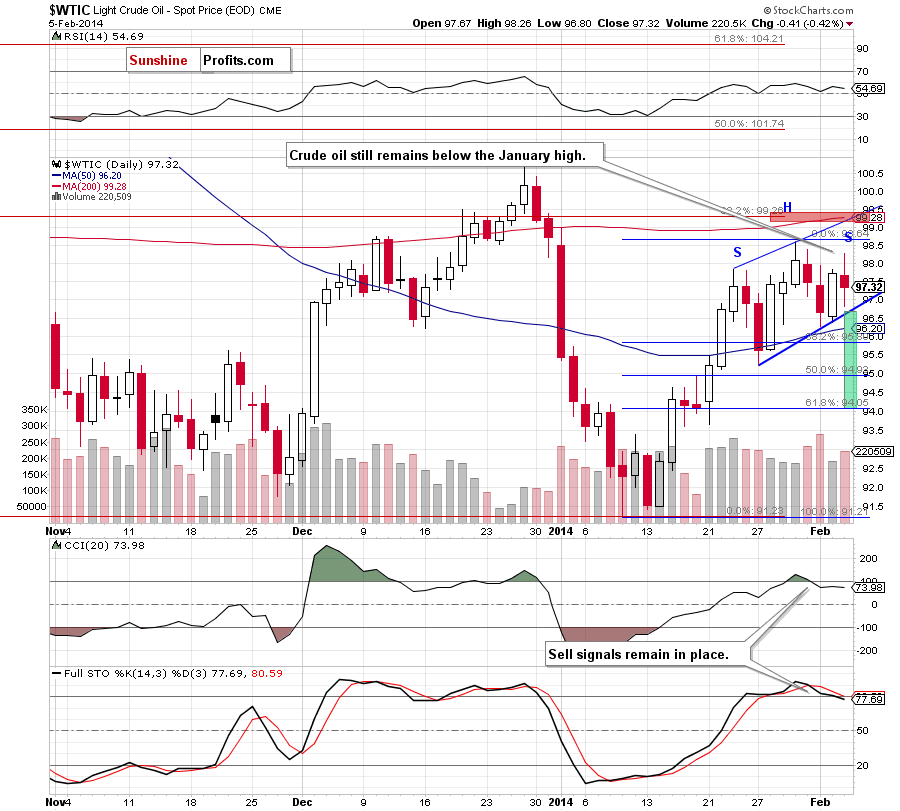
Looking at the above chart, we see that the situation hasn’t changed much. Although crude oil moved higher after the market open, the price quickly reversed and declined. As you see on the daily chart, yesterday’s downswing (similarly to what we saw on Friday and also on Monday) materialized on relatively big volume (especially compared to the previous day), which confirms the strength of the sellers.
From this perspective, we see that crude oil has been trading in a rising trend channel recently. Additionally, when we take a closer look, we can see an unconfirmed head and shoulders formation. According to theory, if the price drops below the neck line (which is also a lower border of the trend channel), we will likely see further deterioration and the downside price target for this pattern will be slightly above $94 where the 61.8% Fibonacci retracement level (based on the recent rally) is. However, we should keep in mind that the first support for crude oil will be the 50-day moving average (currently at $96.20). If it is broken, oil bulls will likely try to stop this corrective move around $95.90 where the 38.2% Fibonacci retracement is. Please note that sell signals generated by the indicators are still in play and support oil bears.
Nevertheless, if today’s economic data encourage oil bulls and they manage to push the price above the January high, the first upside target will be the 200-day moving average, which corresponds to the 38.2% Fibonacci retracement level based on the entire Aug.-Jan. decline (around $99.20) and the upper line of the rising trend channel. Please note that this is a very strong resistance zone, which will likely stop potential growth.
Having discussed the current situation in light crude, let’s take a look at WTI Crude Oil (the CFD).
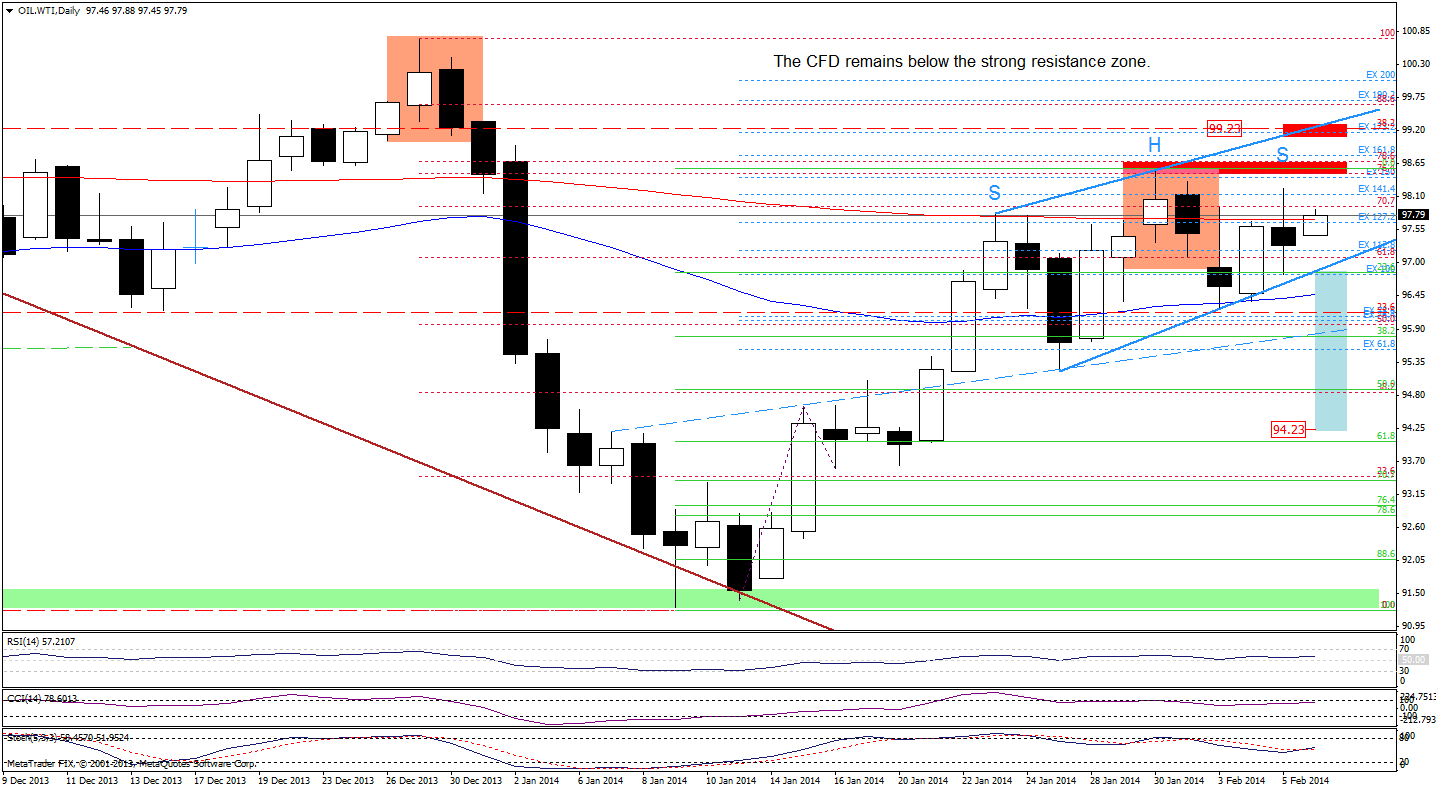
Looking at the above chart, we see that the situation hasn’t changed much as the CFD still remains below the strong resistance zone created by the January high, the 76.4% Fibonacci retracement level, the 150% Fibonacci projection and reinforced by the bearish engulfing pattern. Therefore, what we wrote in our last Oil Trading Alert remains up-to-date.
(…) at this point we should consider two scenarios. If oil bulls do not give up and push the price higher we will likely see an increase to the 38.2% Fibonacci retracement level based on the entire Aug.-Jan. decline (just like in the case of crude oil). On the other hand, if the buyers fail and the CFD drops below the rising blue support line, we will likely see further deterioration. Additionally, if the 50-day moving average is broken, we will see a drop to (at least) the 38.2% Fibonacci retracement level based on the recent rally (which corresponds to the dashed blue support line at the moment) (…) we may see a head and shoulders formation. In this case, it’s quite possible that a potential correction will not stop at 38.2% Fibonacci retracement because the downside price target for this formation is slightly above $94 where the 61.8% Fibonacci retracement is.
Please note that the 38.2% Fibonacci retracement level based on the entire Aug.-Jan. decline corresponds to the upper blue line (which is also the upper border of the rising trend channel) and the 173.2 Fibonacci projection. This is a strong resistance zone and, from this perspective, it will likely stop potential growth.
Summing up, although crude oil rose after the market open, this improvement was only temporary and the overall situation hasn’t changed much. As mentioned earlier, if today’s economic data encourage oil bulls, we may see a breakout above the January high and an increase to the nearest strong resistance zone (created by the 200-day moving average, the 38.2% Fibonacci retracement and the upper line of the rising trend channel). On the other hand, if oil bears show their claws and push crude oil below the lower border of the rising trend channel (which is also the neck line of the head and shoulders formation), we will likely see further deterioration and the downside price target for this pattern will be the 61.8% Fibonacci retracement level based on the recent rally (slightly above $94). Please note that the position of the indicators still favor the sellers.
Very short-term outlook: mixed
Short-term outlook: bullish
MT outlook: bullish
LT outlook: mixed
Trading position (short-term): In our opinion, there were no significant changes in crude oil that justify opening short or long positions at the moment. We will keep you informed should anything change, or should we see a confirmation/invalidation of the above.
Thank you.
Nadia Simmons
Forex & Oil Trading Strategist
Forex Trading Alerts
Oil Investment Updates
Oil Trading Alerts

