
On Friday, crude oil ended higher for the second day in row and gained 0.69% as traders bet that increasing refinery operations and a major new Midwest pipeline will slow the rise in U.S. crude stockpiles. In spite of this growth, light crude finished the week with a 3% loss and its third weekly decline.
The price of light crude has been pressured by a seasonal dip in demand and increasing domestic oil production that has boosted stockpiles, particularly on the U.S. Gulf Coast. Signs of growing inventories pushed crude oil to a new four-month low in the previous week.
However, by Friday, the oil market had returned its focus to refineries returning from maintenance and the startup of TransCanada's MarketLink pipeline to the Gulf. The line, which is due to begin filling next month, will drain supplies from the oil hub in Cushing, Oklahoma by creating another link to the Gulf Coast. As mentioned earlier, this new U.S. crude pipeline will likely slow buildup in U.S. crude stockpiles.
Having discussed the above, let’s move on to the technical changes in the crude oil market.
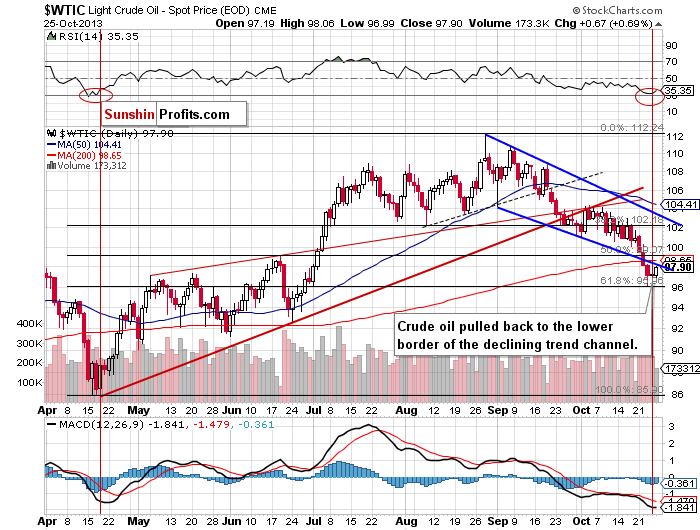
On Friday, after crude oil reached its daily low of $96.99, buyers went into action and triggered an upward move in the following hours. Looking at the daily chart, we see that Friday’s pullback pushed the price of light crude to the previously-broken lower border of the declining trend channel. However, this strong resistance stopped further gains and crude oil closed Friday below it.
Taking the above into account, we should consider two scenarios. If oil bulls do not give up and push the price above this line and break above the previously-broken 200-day moving average, we will likely see further growth to around $101 per barrel. On the other hand, if the buyers show their weakness, oil bears will likely trigger another corrective move and test the October low.
Please note that crude still remains above a strong support zone based on the 50-week moving average, the previously-broken neck level of the reverse head and shoulders formation and the 61.8% Fibonacci retracement level based on the entire April-August rally.
Before we summarize, we want to focus on the XOI once again.
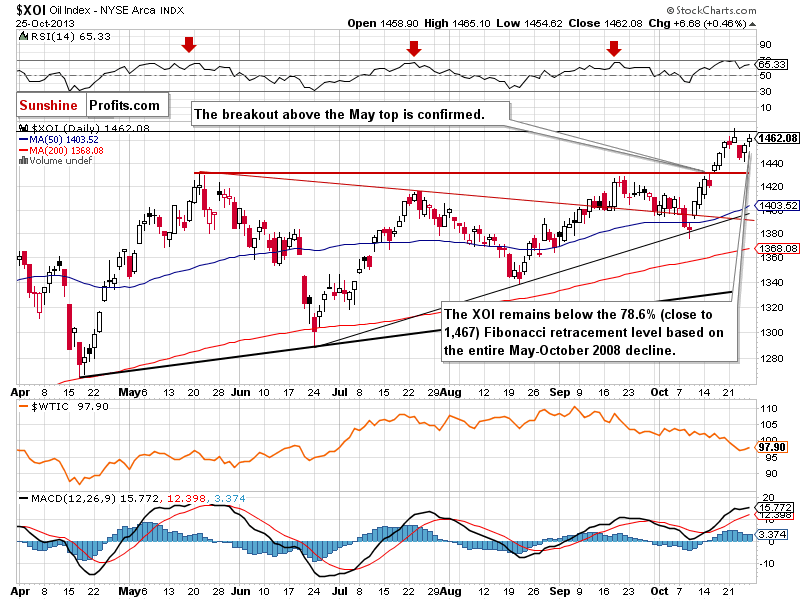
On Friday, the XOI gained 0.46% and climbed to 1,465 (an intraday high). In this way, the oil stock index almost reached the 78.6% Fibonacci retracement level (close to 1,467) based on the entire May-October 2008 decline once again.
Quoting our previous Oil Trading Alert:
(…) Taking the above facts into account, it seems that we may see a double top pattern in the near future. However, if the buyers don’t give up and break above this resistance level, the rally will likely continue. In this case, the next target level will be around 1,560.
In this alert we wrote that there had been similar price action in crude oil and oil stocks in the previous two days. We saw this positive correlation also on Friday. However, it seems that it’s still too early to say if this is a reversal of the current tendency or just a temporary phenomenon.
Summing up, light crude bounced off a strong support zone, which resulted in a pullback to the lower border of the declining trend channel. It serves as strong resistance and is reinforced by the 200-day moving average. Taking these facts into account, we can conclude that the situation is unclear.
Very short-term outlook: mixed
Short-term outlook: bearish
MT outlook: mixed
LT outlook: bullish
Trading position (short-term): we do not suggest opening any positions yet. Taking into account the very short-term picture, the situation is unclear.
Thank you.
Nadia Simmons
Sunshine Profits' Crude Oil Expert
Oil Investment Updates
Oil Trading Alerts

