
On Wednesday, after six consecutive lower closes, crude oil gained 1.31%. Light crude bounced off the monthly low after the EIA showed that crude oil stocks rose less than expected last week. It was the biggest gain since October 17 and the price came back to around $95 per barrel.
Yesterday, the U.S. Energy Information Administration said in its weekly report that U.S. crude oil inventories rose by 1.6 million barrels in the week ended Nov. 1, compared with expectations for an increase of 1.9 million barrels. Total U.S. crude oil inventories stood at 385.4 million barrels. The increase in crude-oil stockpiles was less than analysts had expected but still the highest level for the end of October on EIA records since 1930.
Additionally, stocks of distillate fuel, comprising diesel and heating oil, fell by 4.9 million barrels, compared with expectations of a drop of 900,000 barrels. Stocks fell to the lowest level since May 3 as implied demand was reported at the highest level since mid-February 2008. These declining inventories of refined products bode well for crude oil, as refiners are expected to restart facilities after seasonal maintenance and begin to carve down an overhang in supply.
Having discussed the major factor which pushed the price of light crude higher, let’s move on to the technical changes in the crude oil market (charts courtesy of http://stockcharts.com).
Quoting our previous Oil Trading Alert:
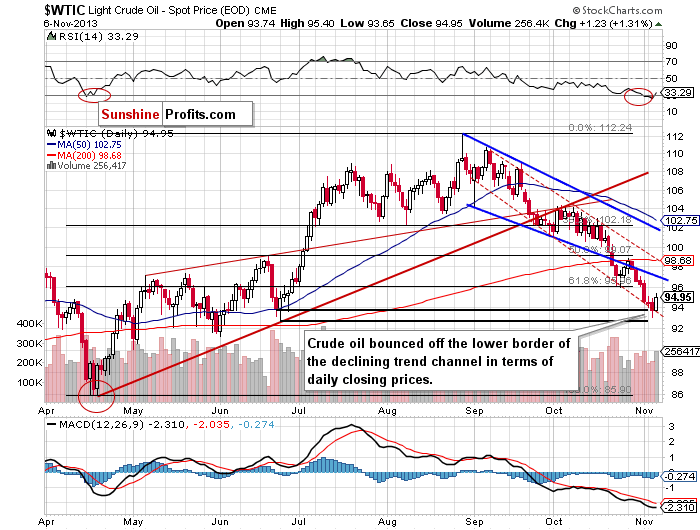
(…) light crude reached a support level based on the bottom of the corrective move that we saw back in June (in terms of daily closing prices) (…) the medium-term rising support line based on the June 2012 and April 2013 lows (currently around $93 per barrel). Additionally, it also reached the long-term support line based on the July 2008 and May 2011 highs.(…) the RSI declined once again and dropped below the 30 level to its lowest level since April. Back then, such a low value of the indicator had a positive impact on light crude. Looking at the above chart, we may see similar price action in the near future – especially when we take into account a positive divergence in the Commodity Channel Index.
Looking at the daily chart, we see that the combination of all the above facts encouraged oil bulls to act and resulted in a pullback which took the price of light crude to an intraday high of $ 95.40. Although crude oil closed the day below $95, it bounced off the lower border of the declining trend channel in terms of daily closing prices (marked with the red dashed line). We saw a similar situation at the beginning of October and, then again, at the end of the previous month. Therefore, if history repeats itself once again, we will likely see further growth in the coming days.
In this case, the first price target for the buyers will be the lower border of the declining trend channel in terms of intraday lows (marked with the bold blue line on the above chart) – currently around $97. If it’s broken, we may see an increase to the previously-broken 200-day moving average at $98.68.
Once we know the current situation in crude oil, let’s move on to the XOI daily chart.
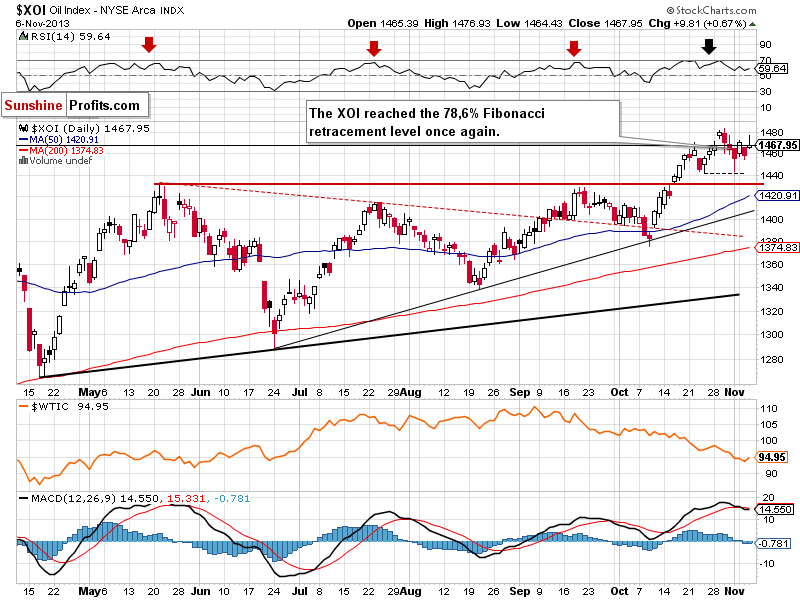
Yesterday, after a higher open, the oil stocks index climbed throughout the session and reached a daily high at 1,476. With this upward move, the XOI broke above the 78.6% Fibonacci retracement level (close to 1,467) once again and closed the day at this level. Taking into account the recent moves, we clearly see the importance of this resistance. If the buyers do not give up and we see a confirmation of the breakout, we will likely see an attempt to move above the 2013 high. However, if they fail once again, we may see further deterioration. In this case, the nearest support level is the bottom of the recent corrective move at 1,443. A further one lies at 1,428-1,430 and it is based on the May and September highs.
Summing up, crude oil bounced off the important support levels and remains in the range of the declining trend channel in terms of daily closing prices, which is a first bullish sign in the very short-term picture. As we wrote in our previous Oil Trading Alert, it seems that a bigger pullback in crude oil is just around the corner and the room for further decline is limited. However, it’s too early to assume that the final bottom of the recent corrective move is already in.
Very short-term outlook: bearish
Short-term outlook: bearish
MT outlook: bearish
LT outlook: unclear
Trading position (short-term): Taking into account the medium- and short-term picture we do not suggest opening any positions yet.
Thank you.
Nadia Simmons
Sunshine Profits' Crude Oil Expert
Oil Investment Updates
Oil Trading Alerts

