
On Wednesday, crude oil gained 0.31% as the EIA data showed that U.S. crude oil inventories fell more than expected last week. However, in the following hours, light crude gave up some gains and closed the day slightly below $98 per barrel.
Yesterday, the U.S. Energy Information Administration showed in its weekly report that U.S. crude oil inventories fell by 2.9 million barrels in the week ended Dec. 13, beating expectations for a decline of 2.3 million barrels. Total U.S. crude oil inventories stood at 372.3 million barrels as of last week, and as mentioned earlier, the data pushed the price higher by stoking sentiments that demand for fuel and energy in the U.S. may be heavier than once anticipated.
Nevertheless, crude oil pared earlier gains later in the day as the Fed said it would begin scaling back its monthly bond purchases in January (and it would continue to scale it down next year if the economy stays on course). After months of intense discussion the Fed's policy-making committee said that it would trim its purchases of long-term Treasury bonds to $40 billion per month from $45 billion, and cut its purchases of mortgage-backed securities to $35 billion per month from $40 billion.
What’s interesting, we didn’t see sharp declines in crude oil as the dollar strengthened on the news. This lack of a sharp selloff caught some investors by surprise. At this point it’s worth mentioning what we wrote in our last Oil Investment Update:
(...) growth in jobs, retail sales, services and overall output in the world's biggest economy - combined with last week's breakthrough budget deal in Washington fueled concerns amid oil investors that the Federal Reserve could make a small cut to its asset purchase program at its policy meeting. As a reminder, a cut in its stimulus would boost the dollar, weighing on most commodities, including oil, that are priced in the currency. However, when we take a closer look at the charts of light crude, we notice that there were periods of time when crude oil moved higher in tune with the greenback. Consequently, higher values of the dollar do not necessarily mean lower oil prices. Additionally, even if the Fed decides to move toward tapering its bond buying program, it will suggest that the U.S. economy is recovering and, as is well known, an improving economy means that oil demand may grow, which will likely trigger a move up in light crude.
Having discussed the above, let’s move on to the technical changes in the crude oil market (charts courtesy of http://stockcharts.com).
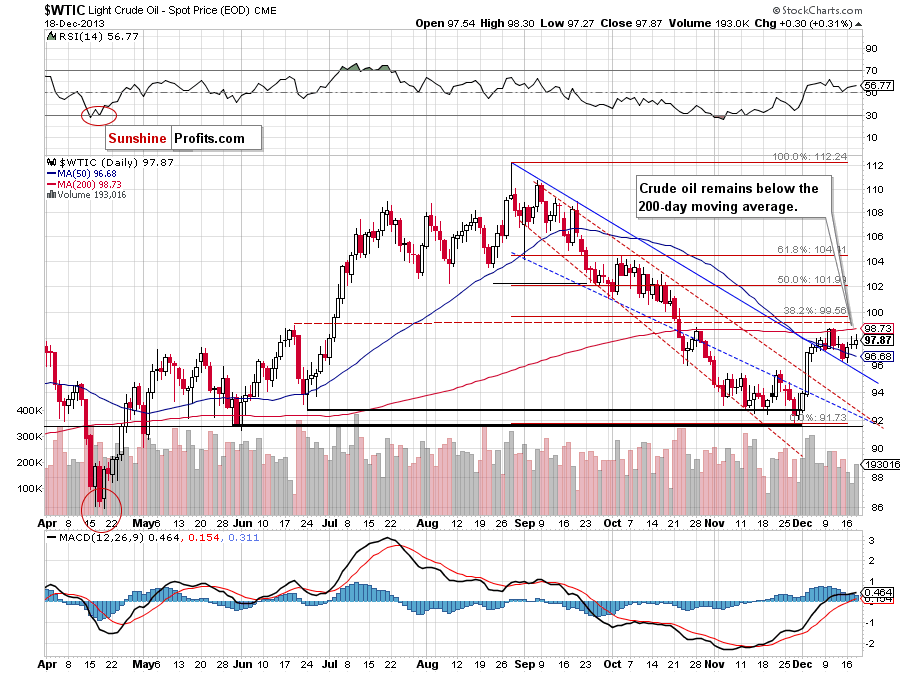
Looking at the above chart, we see that although there is a white candlestick representing the increase, the situation hasn’t changed much. Yesterday, after the market open, crude oil declined and reached the Tuesday low. This support (not strong, but still) encouraged oil bulls to act and resulted in an increase to a daily high of $98.30. However, after reaching this level, crude oil gave up the gains, reversed course and closed the day slightly above the previous closing price once again.
As you can see on the above chart, crude oil still remains above its 50-day moving average and the upper line of the declining trend channel, which serves as major short-term support. The nearest major short-term resistance which keeps further growth in check is still the 200-day moving average.
Having discussed the current situation in crude oil, let’s take a look at WTI Crude Oil (the CFD).
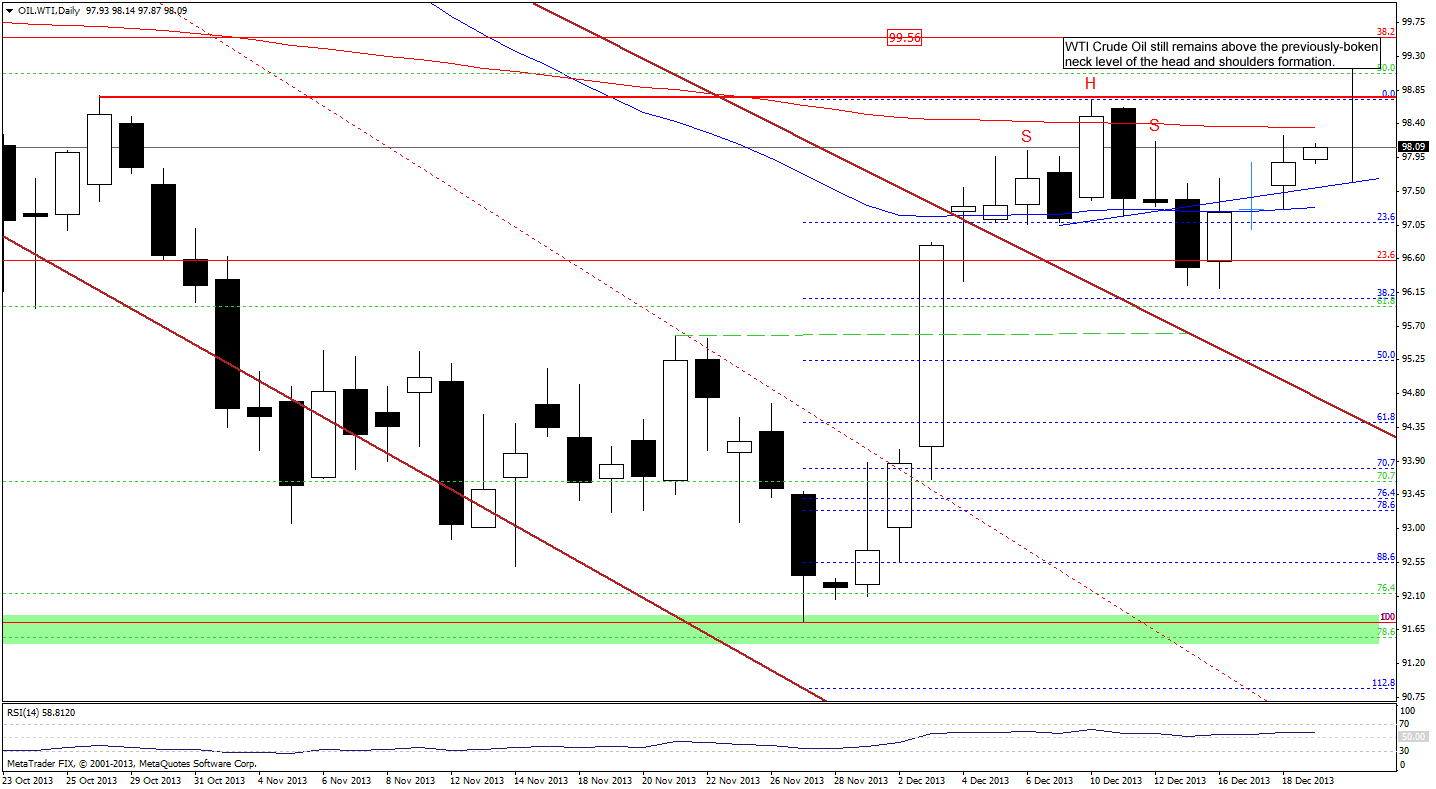
2 days ago, we wrote that the first upside target for buyers was around $98.16 and if it was broken, the next one would be the 200-day moving average. Back then, oil bulls didn’t manage to push the CFD to these levels, however, WTI Crude Oil remained above the previously-broken neck line (marked in blue), which was a positive signal. Yesterday, the buyers pushed the buy buttons, which resulted in growth to a daily high of $98.25. Looking at the above chart, we see that although the CFD reached its first upside target, it didn’t give up the gains and today (at least at the time when these words are written) is trading near its yesterday’s high, which is a positive sign.
From this perspective, it seems that we may see another attempt to break above the 200-day moving average in the near future.
Please note that our last week’s assumption remains up to date: “(…) taking into account the fact that crude oil and WTI Crude Oil move together in the same direction, it seems that a move in the CFD will trigger a similar move in light crude.”
Once we know the above, let’s take a look at the NYSE Arca Oil Index (XOI) weekly chart.
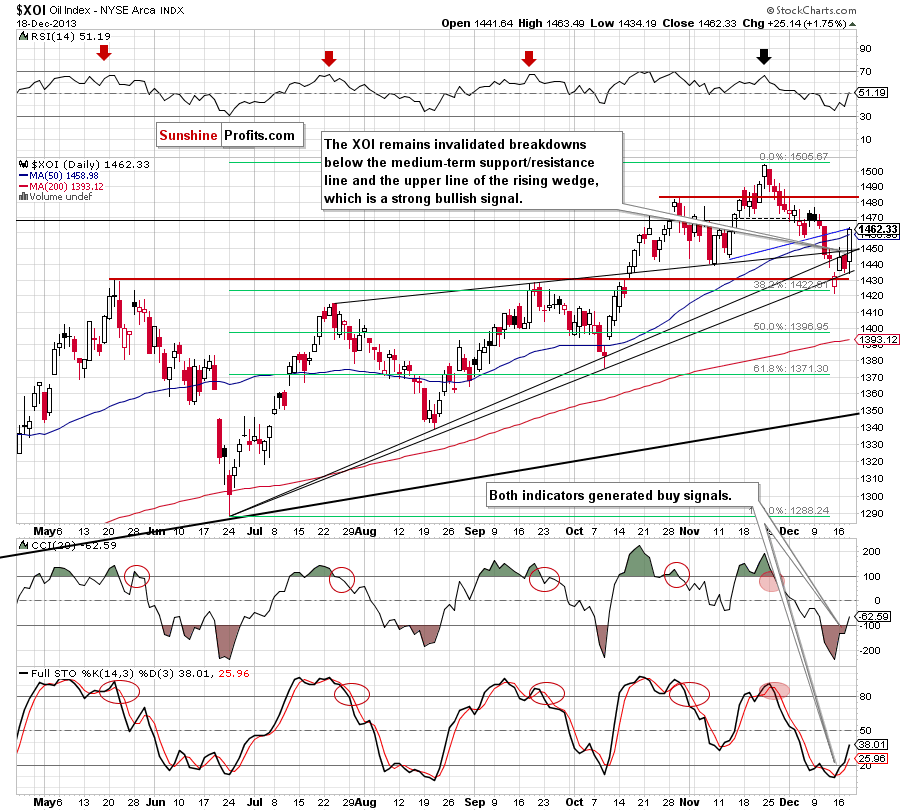
The first thing that catches the eye on the above chart is an invalidation of the breakdown below the upper medium-term rising support/resistance and the upper line of the rising wedge, which is a strong bullish signal. Yesterday, after the market open, the oil stock index re-tested the strength of the lower medium-term rising support line and hit its daily low at 1,434. As you can see on the above chart, this support line encouraged buyers to act and resulted in a sharp rally. With this upward move, the XOI not only broke above its resistance zone, but also reached the previously-broken neck line (marked in blue) of the head and shoulders pattern.
At this point, it’s worth noting that the buyers realized their pro-growth scenario, which they had failed to do on Monday. As a reminder, on Tuesday in our Oil Trading Alert we wrote that if the oil stock index came back above the previously-broken upper medium-term rising support line and the upper line of the rising wedge we might see an upward corrective move to at least 1,456-1,461 where the 50-day moving average and the previously-broken neck line of the head and shoulders pattern were. However, back then, the sellers pushed the sell button and took the XOI below these lines. Fortunately for oil stock holders, this time the situation developed in their favor.
Nevertheless, we should keep in mind that this area (around 1,463) is reinforced by the upper line or the medium-term rising wedge (you can see this line more clearly on the weekly chart right here). Therefore, a pause or pullback should not surprise us. If the XOI breaks above this major medium-term resistance, we will likely see an upswing to at least 1,476 or even to 1,483 where the previously 2013 high is.
Finishing this part of our Oil Trading Alert, please note that the CCI and Stochastic Oscillator generated buy signals, which supports further improvement in the near future.
Summing up, overall, the outlook hasn’t changed much as crude oil remains between the 50-day and 200-day moving averages. Consequently, the situation remains bullish.
Very short-term outlook: bullish
Short-term outlook: bullish
MT outlook: mixed with bullish bias
LT outlook: mixed
Trading position (short-term): Long. Stop-loss order for this position: $91.55. Stop-loss order for WTI Crude Oil (CFD): $91.30. We will keep you informed should anything change, or should we see a confirmation/invalidation of the above.
Thank you.
Nadia Simmons
Sunshine Profits' Crude Oil Expert
Oil Investment Updates
Oil Trading Alerts

