
On Monday, crude oil gained 0.90% after U.S. economic indicators fueled expectations that the Fed could hold off on tapering its stimulus program this week and wait until January - or even March. In this way, light crude rebounded and closed the day above $97 per barrel.
Yesterday, the Federal Reserve Bank of New York reported that its Empire State manufacturing index came in at 0.98 in December compared to November's -2.21 reading, though analysts were expecting the index to rise to 4.75. Meanwhile, the Federal Reserve reported that U.S. industrial production advanced 1.1% in November after having edged up 0.1% in October, beating consensus forecasts for a 0.5% November reading. Additionally, preliminary U.S. manufacturing purchasing managers’ index declined to a seasonally adjusted 54.4 in December from a final reading of 54.7 in November.
Having discussed the above, let’s move on to the technical changes in the crude oil market (charts courtesy of http://stockcharts.com).
Quoting our last Oil Trading Alert:
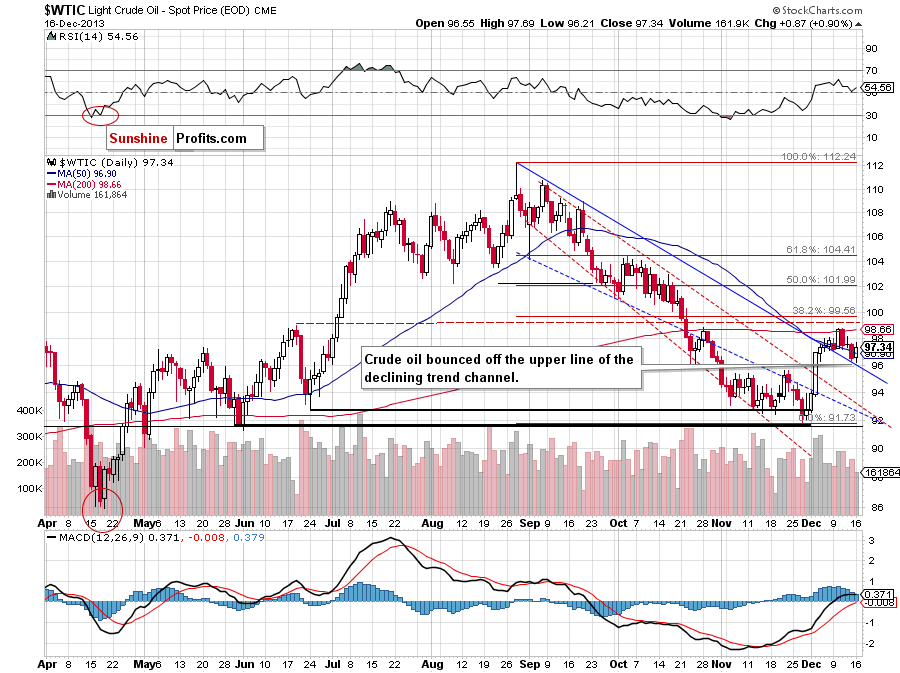
(…) although the sellers tried to realize their scenario, the upper line of the declining trend channel stopped further declines. At this point, we should consider two scenarios. If this support line encourages oil bulls, we will likely see an upswing to at least $98.18. On the other hand, if the buyers fail, we will likely see further deterioration and the downside price target will be around $95.65.
As you can see on the above chart, light crude bounced off the short-term support line created by the upper line of the declining trend channel and came back above its 50-day moving average. Although oil bulls didn’t manage to push crude oil to its first upside target, it seems that the above positive signals may encourage them to realize this scenario. Nevertheless, crude oil is still trading below the 200-day moving average, which serves as major short-term resistance and keeps further growth in check.
Having discussed the current situation in crude oil, let’s take a look at WTI Crude Oil (the CFD).
Quoting our previous Oil Trading Alert:
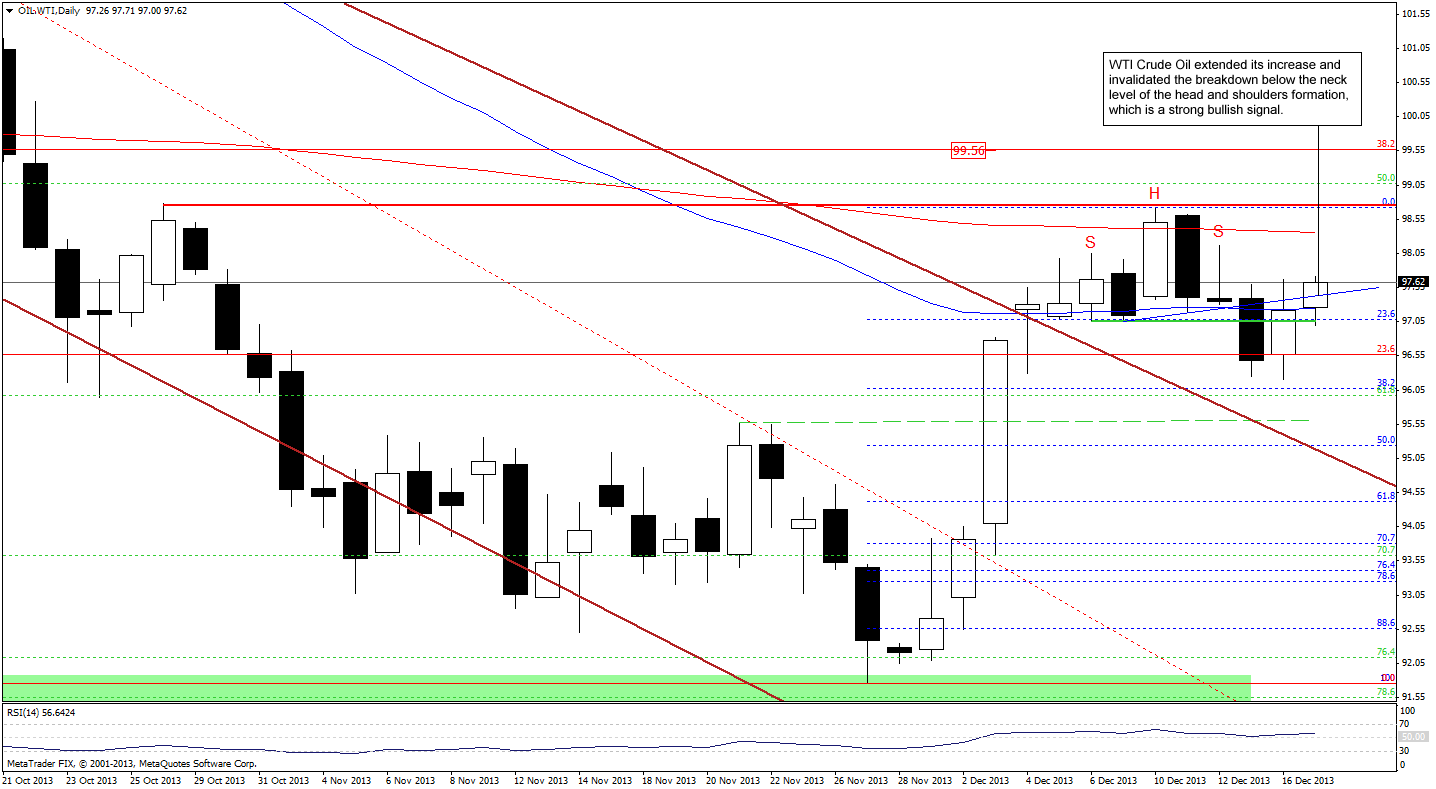
(…) the price reached the previously-broken 50-day moving average and invalidated the breakdown below a support zone based on the Dec. 6 and Dec. 9 lows. If we see further improvement and the CFD invalidates the breakdown below the neck line (marked in blue), we will likely see an upward move to at least $98.16.
Looking at the above chart, we see that WTI Crude Oil extended its growth and invalidated the breakdown below the neck line, which is a strong bullish signal. According to what we wrote yesterday, the first upside target is around $98.16. If it is broken, the next one will be the 200-day moving average, which stopped further growth in the previous week.
Please note that our last week’s assumption remains up to date: “(…) taking into account the fact that crude oil and WTI Crude Oil move together in the same direction, it seems that a move in the CFD will trigger a similar move in light crude.”
Once we know the above, let’s take a look at the NYSE Arca Oil Index (XOI) weekly chart.

Quoting our last Oil Trading Alert:
(…) the XOI reversed course after reaching the 38.2% Fibonacci retracement level based on the entire June-November rally. Although this support encouraged buyers to act, they didn’t manage to push the index above the previously-broken medium-term rising support line and the XOI closed the day below it (…) even if the buyers do not give up and the oil stock index comes back above this line, it will have to break above the medium-term rising support line based on the June and August lows and the upper line of the rising wedge before we see a bigger upward corrective move.
As you can see on the daily chart, the XOI extended its growth on Monday. However, the combination of the previously-broken upper medium-term rising support line and the upper line of the rising wedge stopped further improvement and the oil stock index closed the day below this resistance zone. If the buyers do not give up and the oil stock index comes back above this lines, we will may see an upward corrective move to at least 1,456-1,461 where the 50-day moving average and the previously-broken neck line of the head and shoulders pattern are. On the other hand, if the buyers fail, we will likely see a pullback to the lower rising support line (currently around 1,435) or even to the Friday low at 1,421.
Summing up, crude oil bounced off the short-term support line and came back above its 50-day moving average, which may encourage the buyers to push the price higher – especially when we take into account the situation in the CFD. Consequently, the situation remains bullish.
Very short-term outlook: bullish
Short-term outlook: bullish
MT outlook: mixed with bullish bias
LT outlook: mixed
Trading position (short-term): Long. Stop-loss order for this position: $91.55. Stop-loss order for WTI Crude Oil (CFD): $91.30. We will keep you informed should anything change, or should we see a confirmation/invalidation of the above.
Thank you.
Nadia Simmons
Sunshine Profits' Crude Oil Expert
Oil Investment Updates
Oil Trading Alerts

