
Trading position (short-term; our opinion): In our opinion no positions are justified from the risk/reward perspective.
On Friday, crude oil extended losses as Chinese manufacturing and U.S. employment data disappointed market participants. As a result, light crude tested the strength of the March low. Will this support level stop oil bears’ charge in the nearest future?
On Friday, although official data showed that China's manufacturing PMI rose to 51.7 from 51.0 in July (beating market expectations for a 51.4 reading), China's HSBC final manufacturing PMI ticked down to 51.7 last month from 52.0.
Additionally, later in the day, the Labor Department showed that the U.S. economy added 209,000 jobs in July, missing expectations for an increase of 233,000. The report also showed that the U.S. unemployment rate ticked up to 6.2% last month from 6.1% in June, while analysts had expected the rate to remain unchanged in July. On top of that, the revised Thomson Reuters/University of Michigan consumer sentiment index missed expectations for a reading of 82.0 (increasing to 81.8 in the previous month from 81.3 in June). As we mentioned earlier, these numbers disappointed market participants and fueled concerns over the strength of global economic recovery. As a result, light crude extended losses and dropped to its lowest level since six months.
Although the data from the Institute of Supply Management (which showed that the U.S. manufacturing PMI rose to 57.1 in the previous month from 55.3 in June, beating expectations for an increase to 56.0) erased losses somewhat, the commodity still remains only few cents above the March low. Will light crude rebound from here in the coming days? Let’s check the technical picture of the commodity (charts courtesy of http://stockcharts.com).
In our Oil Trading Alert posted on July 14, we wrote the following:
(…) the initial downside target will be around $98.74, where the April low is. However, taking into account the fact that sell signals remain in place, it seems that oil bears may push the commodity even lower (the next target would be around March low of $97.55).
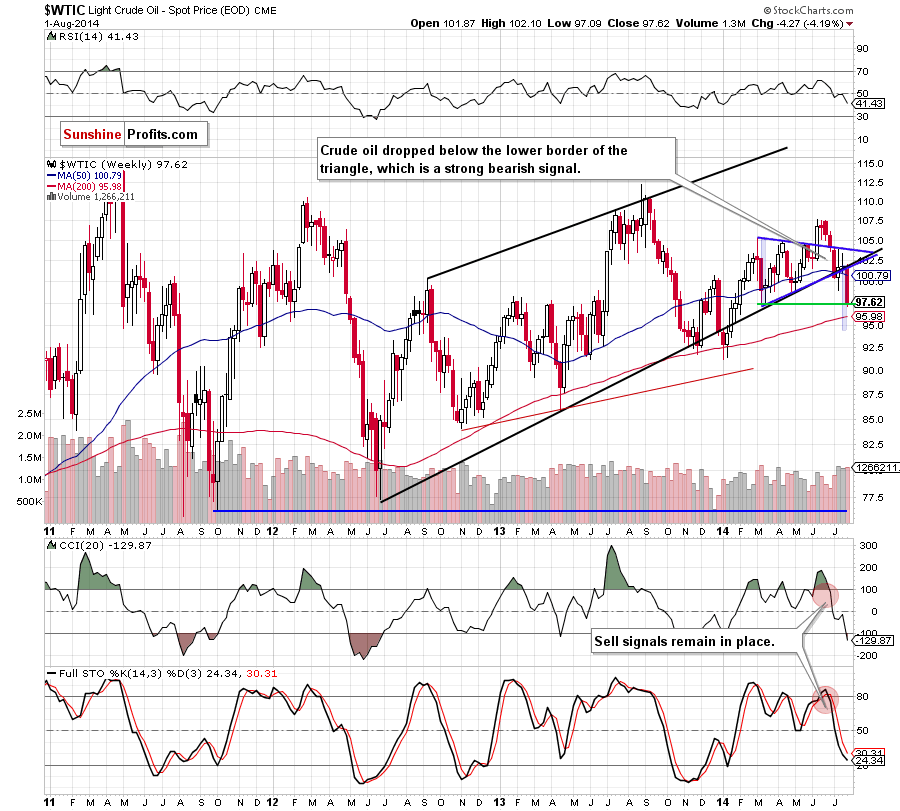
Looking at the weekly chart, we can summarize it: third time lucky. As you see above, although there were two unsuccessful attempts to break below the lower border of the medium-term triangle in July, oil bears finally managed to realize the above-mentioned scenario and pushed the commodity to the March low. What’s next? If this support level holds, we’ll see a rebound from here in the coming week. Nevertheless, we should keep in mind that sell signals remain in place, which suggests that even if we’ll see a short-term improvement, the commodity will likely test the strength of the 200-week moving average – similarly to what we saw several times in the past (for example in April, November 2013 and also at the beginning of the year).
Can we infer something more from the very short-term chart? Let’s check.
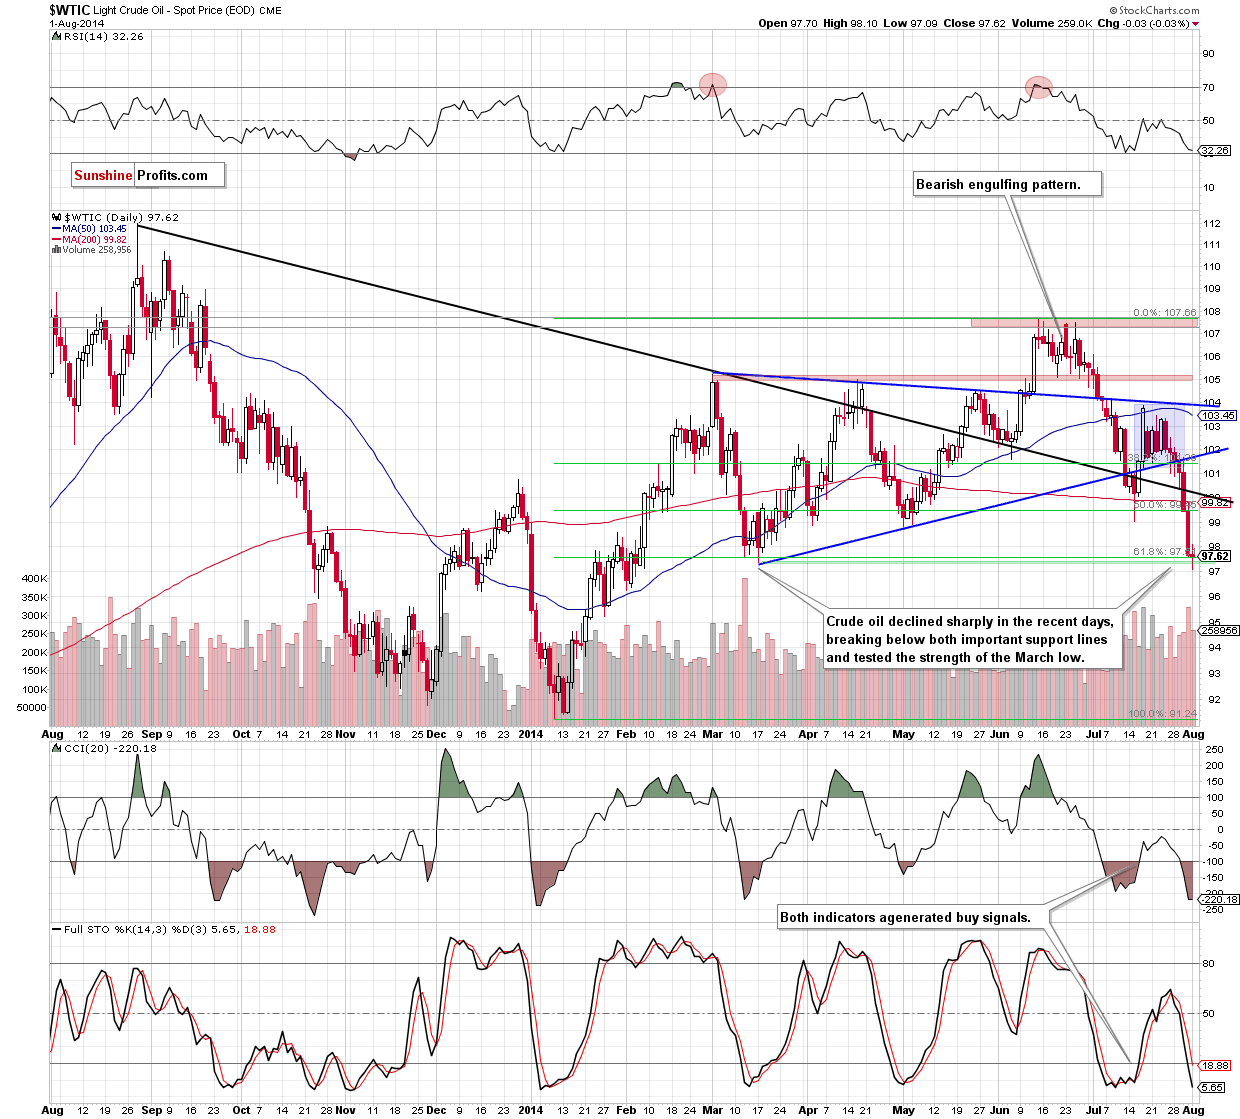
From the daily perspective, the situation has deteriorated significantly as crude oil declined (and confirmed the breakdown) not only below the lower border of the medium-term triangle (marked with blue), but also under the long-term black support line, the 200-day moving average and the psychological barrier of $100. As we have pointed out before, with this downward move the commodity reached the March low and the 61.8% Fibonacci retracement based on the entire Jan-June rally. Therefore, at this point, we should consider two scenarios. On one hand, if this support area encourages oil bulls to push the buy button, we’ll see a corrective upswing to at least May low of $98.74. However, if it is broken, light crude will extend declines and the next downside target will be around $94.76-$95.21, where the strong support zone (created by the 76.4% and 78.6% Fibonacci retracements based on the entire 2014 rally and the Jan. 27 bottom) is.
Please note that the CCI and Stochastic Oscillator are oversold, while the RSI approached the level of 30 once again. We saw similar readings of the indicators in mid-July. Back then, they preceded a bigger corrective upswing, therefore, if history repeats itself, we may see a rebound from here. Nevertheless, we should keep in mind that as long as there is no buy signals, another test of the strength of the support zone is likely.
Summing up, the major event of the recent days was the breakdown below the key support lines, the 200-day moving average and the psychological level of $100. As we mentioned earlier, the breakdown is confirmed, which makes the short-term situation bearish. Despite this fact, the commodity reached the support zone, which could decelerate further deterioration. Taking into account the fact that crude oil could go both north and south from here, we think that as long as we won’t receive more clues about future moves (like a breakdown below the support zone or buy signals) opening any position is not justified from the risk/reward perspective.
Very short-term outlook: mixed
Short-term outlook: bearish
MT outlook: bearish
LT outlook: mixed
Trading position (short-term): No positions are justified from the risk/reward perspective at the moment, but we will keep you informed should anything change.
Thank you.
Nadia Simmons
Forex & Oil Trading Strategist
Przemyslaw Radomski, CFA
Founder, Editor-in-chief
Gold & Silver Trading Alerts
Forex Trading Alerts
Oil Investment Updates
Oil Trading Alerts

