
Trading position (short-term; our opinion): Speculative short positions in crude oil seem to be justified from the risk/reward perspective.
On Wednesday, crude oil climbed to a three-week high as upbeat wholesale pricing data and the EIA report, which showed an unexpected increase in demand for petroleum products, supported the price. Thanks to this news, light crude climbed above $102 once again and reached an important resistance zone. Will it stop bulls’ charge?
Yesterday, the U.S. Energy Information Administration showed in its weekly report that U.S. crude oil inventories increased by 947,000 barrels in the week ending May 9, defying expectations for a decline of 100,000 barrels. Despite this bearish numbers, stockpiles of gasoline and distillates fell, contrary to analysts' expectations of small increases. The amount of gasoline stored in the U.S. was down 800,000 barrels from the previous week (while analysts had expected rise of 100,000) and stocks of distillates, which include heating oil and diesel, dropped by 1.1 million barrels instead of rising by the expected 600,000 barrels.
An additional bullish factor that supported the price was upbeat wholesale pricing data. Yesterday, the Commerce Department showed that producer prices rose by 0.6% in April, beating expectations for a 0.2% gain. Additionally, year-over-year, the PPI increased 2.1% in the previous month, above forecasts for a 1.7% increase. The core producer price index (without volatile food and energy items) advanced 0.5% in April, while analysts had expected a 0.2% increase. Core produces prices rose by 1.9% last month, also beating expectations for a 1.4% gain.
As we mentioned earlier, the combination of an increase in demand for petroleum products (at an unusual time of year) and upbeat wholesale pricing data pushed crude oil to a three-week high. However, as it turned out, despite this positive numbers, the price of light crude started to trend down later in the day and slipped to slightly above $102. Will it drop much lower from here? Let’s look for answer on the charts (charts courtesy of http://stockcharts.com).
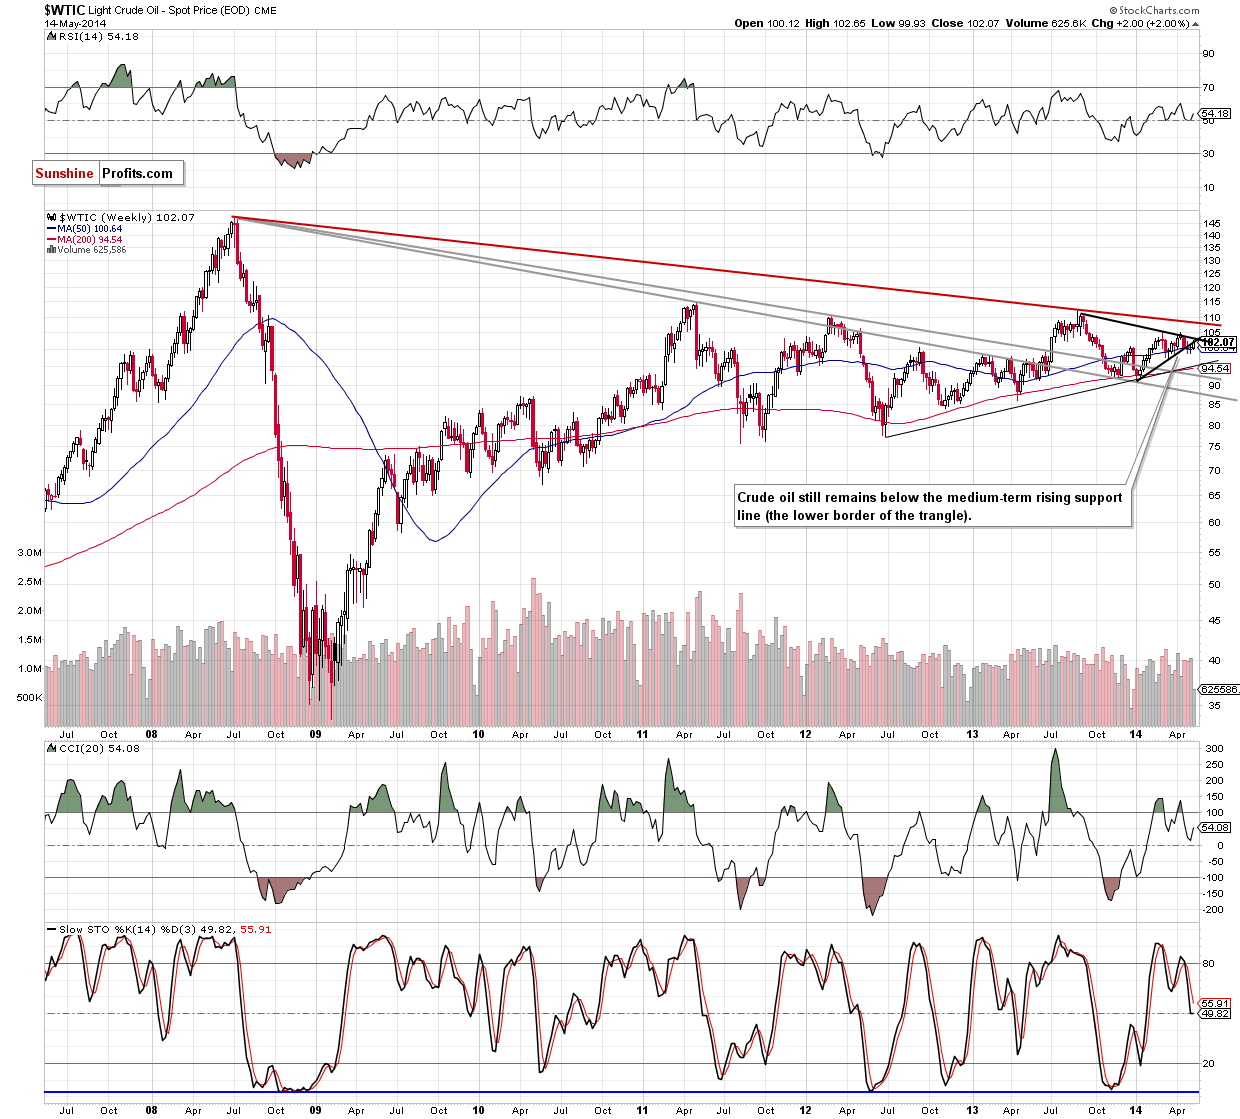
From today’s point of view, we see that despite yesterday’s increase crude oil still remains below both medium-term resistance lines. Therefore, what we wrote yesterday is up-to-date:
(…) we remain convinced that as long as this strong resisrance line remains in play further deterioration is still likely. (…) from this perspective, the recent upward move seems to be nothing more than a veryfication of the breakdown. If this is the case, the bearish scenario (…) will be in play:
(…) if the commodity extends losses (…), we will likely see further deterioration and a drop even to around $95, where the medium-term support line (based on the June 2012 and January 2014 lows) is.
What can we infer from the short-term chart?
Yesterday, we wrote the following:
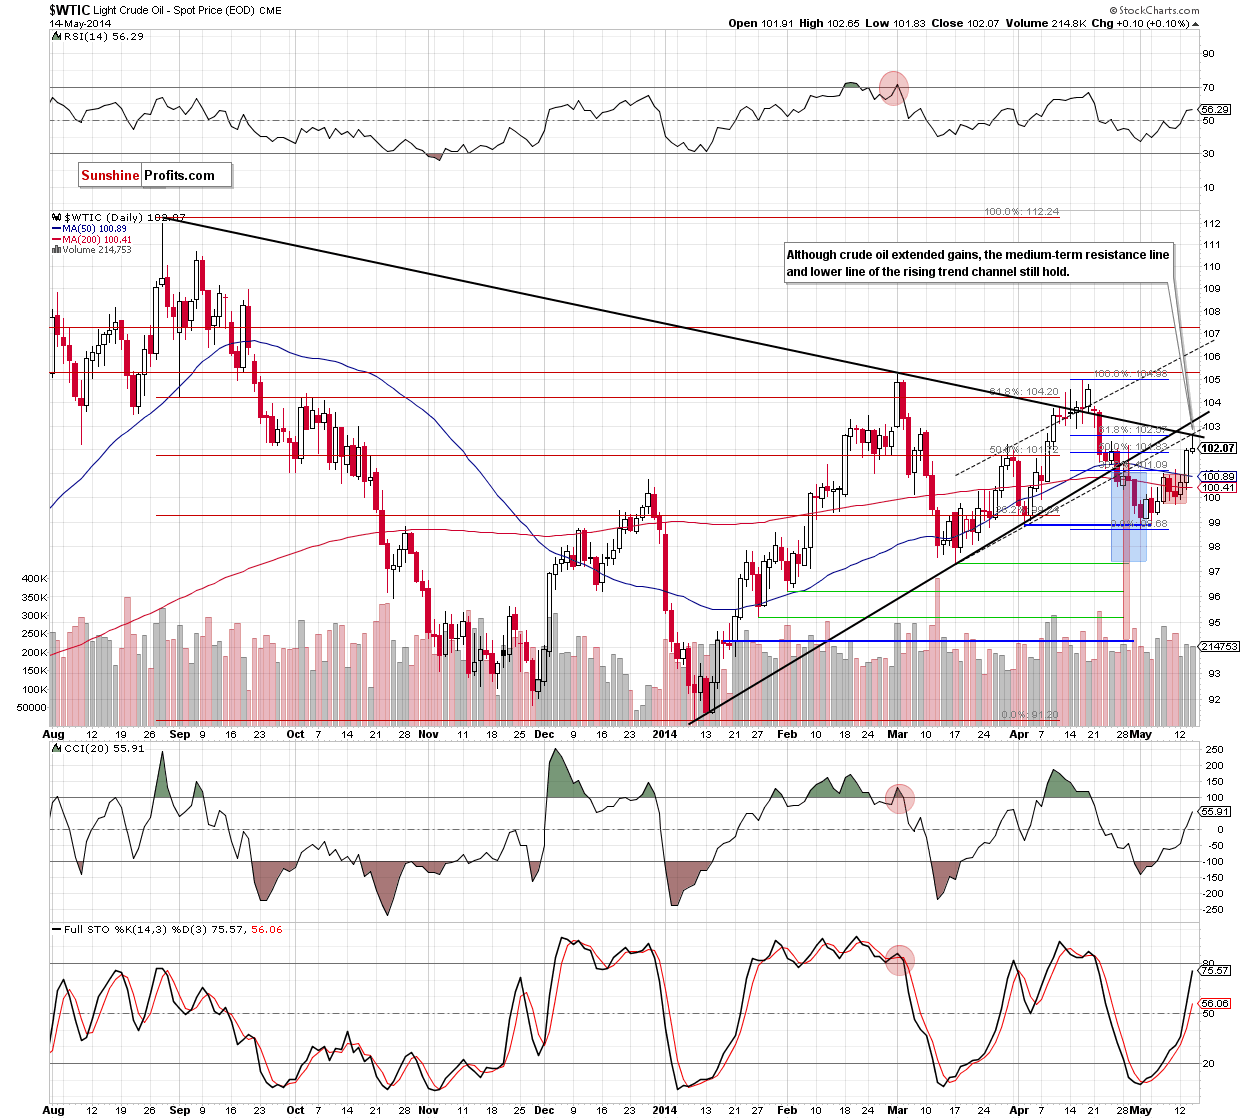
(…) the commodity still remains below (…) the medium-term black line and the lower border of the rising trend channel (…) if the 50% Fibonacci retracement is broken, we will likely see a test of the strenght of these key resitance lines (currently around $102.68 and $103.05). (…) this area is also reinforced by the black declining resistance line, which is also the upper line of the triangle.
Looking at the above chart, we see that crude oil extended gains and reached the above-mentioned upside target, hitting an intraday high of $102.65. Despite this improvement, the strong resistance zone (created by both medium-term black lines, the lower border of the rising trend channel and the 61.8% Fibonacci retracement) succesfully stopped further improvement and triggered a downswing to slightly above $102. As a result, yesterday’s candletick has an elongate upper shadow, which indicates that selling pressure overwhelmed buying pressure. From our experience, such situation suggests that oil bears will continue to push the price lower as we saw similar price actions on Aug. 28, Apr. 16 and Apr. 29. If history repeats itself and crude oil reverses, this will mean that the recent rally was nothing more than a verification of the breakdown below major resistance lines. We believe that will happen in the coming days and the above-mentioned resistance zone will be strong enough to stop further improvement. Please note that if we see such price action, the first downside target will be the previously-broken 50-day moving average (currently around $100.90).
Summing up, although crude oil moved higher once again, the overall situation hasn’t changed much as the commodity still remains below 2 medium-term black lines and the lower border of the rising trend channel. Consequently, we think that the combination of these resistance lines and the 61.8% Fibonacci retracement will be strong enough to stop further improvement and trigger a pullback in the coming days.
Very short-term outlook: bearish
Short-term outlook: bearish
MT outlook: mixed
LT outlook: mixed
Trading position (short-term): Short. Stop-loss order: $104. We will keep you informed should anything change, or should we see a confirmation/invalidation of the above.
Thank you.
Nadia Simmons
Forex & Oil Trading Strategist
Przemyslaw Radomski, CFA
Founder, Editor-in-chief
Gold & Silver Trading Alerts
Forex Trading Alerts
Oil Investment Updates
Oil Trading Alerts

