
On Thursday, crude oil continued its rally and rose to a fresh five-week high for a fifth straight session as U.S. gross domestic product and weekly jobless claims reports beat expectations and weighted on price. Light crude gained 0.19% and hit its intraday high of $97.99 per barrel.
Yesterday, the Commerce Department said that third quarter U.S gross domestic product grew at a faster pace than initially thought, recording a 3.6% rise, compared with forecasts of 3.2% growth. Additionally, the Labor Department said that new claims for unemployment benefits fell for a third straight week last week. Initial claims were 298,000 in the Nov. 30 week, below economists' expectations of 320,000.
Taken together, the latest data are a strong sign of economic improvement, which means stronger oil demand. Therefore, they fueled optimism among oil investors and encouraged them to push the price higher for a fifth straight session. Please note that today oil traders will be looking for further signals with the scheduled 8:30 a.m. release of the November non-farm payroll report.
Having discussed the above, let’s move on to the technical changes in the crude oil market (charts courtesy of http://stockcharts.com).
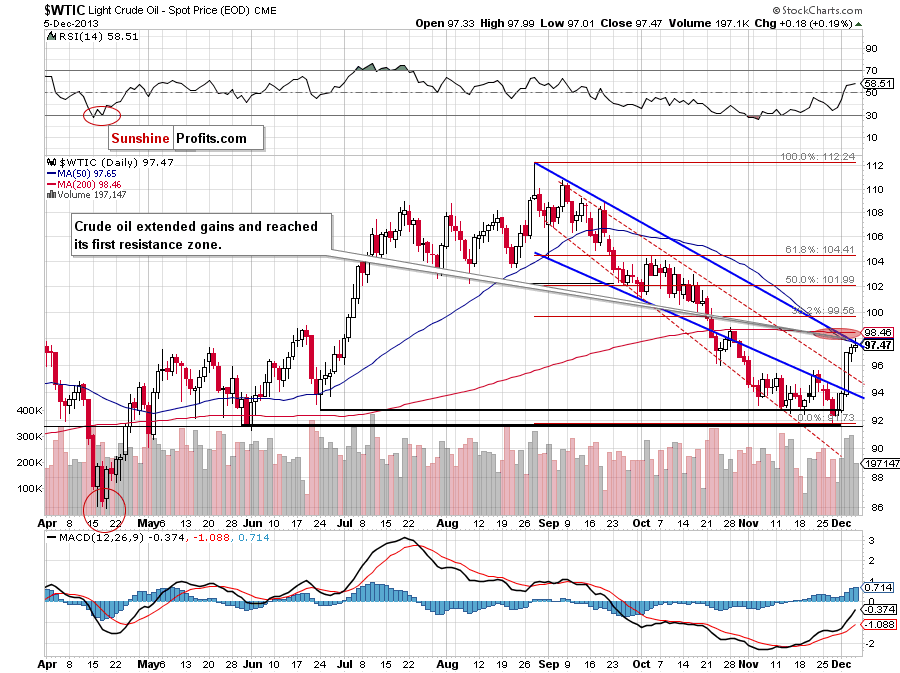
On the above chart, we see that crude oil continued its rally during Thursday’s session and reached first resistance zone created by the upper border of the declining trend channel and the 50-day moving average. Additionally, yesterday’s increase materialized on lower volume (compared with previous days). Taking the above facts into account, we can conclude that a small pause after a fifth-day rally should not surprise us.
However, if this resistance level is broken, the next target for oil bulls will be the 38.2% Fibonacci retracement level around $99.55. The nearest support is the previously-broken upper line of the declining trend channel in terms of daily closing prices.
Once we know the current situation in crude oil, let’s take a look at the NYSE Arca Oil Index (XOI) weekly chart.
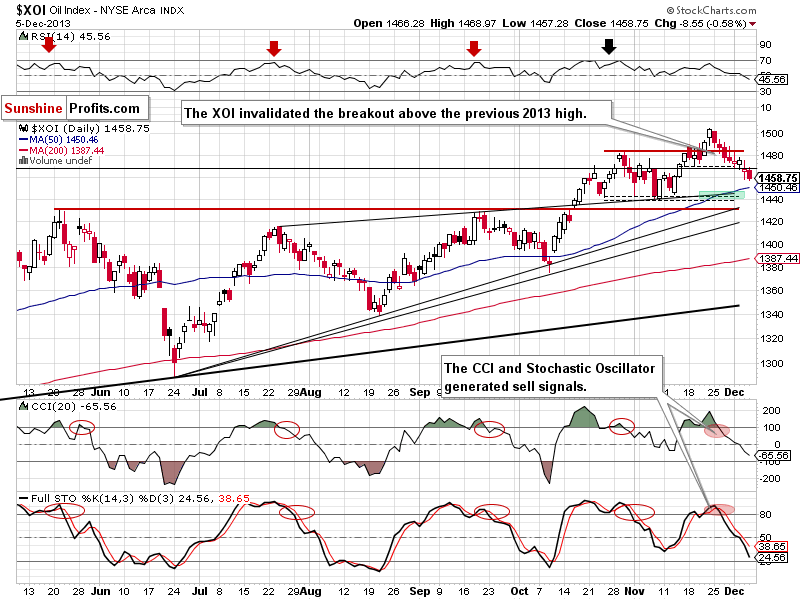
Looking at the above chart, we see that the oil stock index extended its decline and dropped below the upper line of the rising wedge (mentioned in yesterday's comment). At this point, it’s worth noting that sell signals generated by the indicators remain in place and encourage sellers to act. Taking these facts into account, we may see further deterioration. The first downside target is the 50-day moving average (currently at 1,450), slightly below is the next one - created by the upper line of the rising wedge (marked with the thin black line) and the bottom of the correction that we saw at the beginning of November (around 1,440-1,446).
Summing up, crude oil increased once again and reached its first resistance zone. Yesterday’s growth materialized on lower volume (compared with previous days), which suggests that the strength of the buyers weakened. Therefore, a pause in the near future should not surprise us.
Very short-term outlook: bullish
Short-term outlook: bullish
MT outlook: mixed with bullish bias
LT outlook: mixed
Trading position (short-term): Long. Stop-loss order for this position: $91.55. We will keep you informed should anything change, or should we see a confirmation/invalidation of the above.
Thank you.
Nadia Simmons
Sunshine Profits' Crude Oil Expert
Oil Investment Updates
Oil Trading Alerts

