

Trading position (short-term; our opinion): No positions are justified from the risk/reward perspective.
On Tuesday, the black gold gained 0.66% and closed another day above $51. How high could the commodity go in the coming day(s)?
Let’s take a closer look at the daily chart and find out (charts courtesy of http://stockcharts.com).
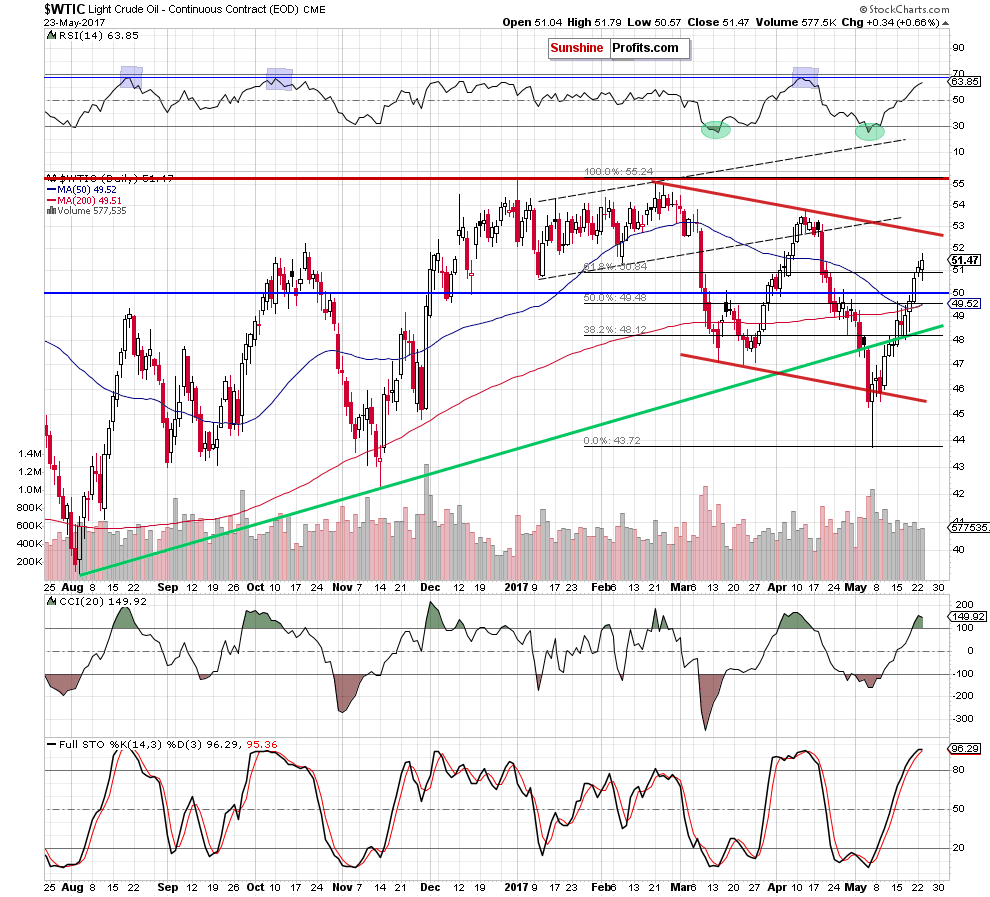
From today’s point of view, we see that crude oil extended gains above the 61.8% Fibonacci retracement, which means that what we wrote yesterday remains up-to-date:
(…) crude oil broke above the 61.8% Fibonacci retracement yesterday (…) Such price action suggests that we may see an increase to around $51.73 (the 70.7$ retracement) or even to the resistance zone created by the 76.4% and 78.6% Fibonacci retracements around $52.37-$52.61 in the coming day(s). On the daily chart, we see that slightly above this area is also the upper border of the red declining trend channel, which could stop oil bulls and trigger another bigger move to the downside.
At this point it is worth noting that yesterday’s increase materialized on a smaller volume and the CCI and Stochastic Oscillator climber to their overbought areas, which suggests that reversal and lower prices of the black gold may be just around the corner.
Summing up, crude oil extended gains above the 61.8% Fibonacci retracement, which suggests a test of the next Fibonacci retracement in the coming day(s).
Very short-term outlook: mixed with bullish bias
Short-term outlook: mixed
MT outlook: mixed
LT outlook: mixed
Trading position (short-term; our opinion): No positions are justified from the risk/reward perspective. We will keep you – our subscribers – informed should anything change.
Thank you.
Nadia Simmons
Forex & Oil Trading Strategist
Przemyslaw Radomski, CFA
Founder, Editor-in-chief, Gold & Silver Fund Manager
Gold & Silver Trading Alerts
Forex Trading Alerts
Oil Investment Updates
Oil Trading Alerts

