
Trading position (short-term; our opinion): In our opinion no positions are justified from the risk/reward perspective.
On Thursday, crude oil gained 1.03% as stronger-than-expected U.S. economic data weighted on the price. Thanks to these numbers, light crude closed the day above $101 per barrel and broke above an important resistance.
Yesterday, the Department of Labor reported that the number of individuals filing for initial jobless benefits last week declined by 10,000 (while analysts had expected an increase of 4,000) and fell to the lowest level since late November last week. Additionally, official data showed that U.S. economic fourth quarter growth was revised up to 2.6% from a preliminary estimate of 2.4%. The data also showed that personal spending was revised up to 3.3% from 2.6% initially, the fastest rate of growth in three years. The better-than-expected reading fueled hopes that the slowdown in economic activity seen at the beginning of the year would be temporary and supported crude oil, pushing the price above $101.
Having discussed the above, let’s move on to the technical changes in the crude oil market (charts courtesy of http://stockcharts.com.)
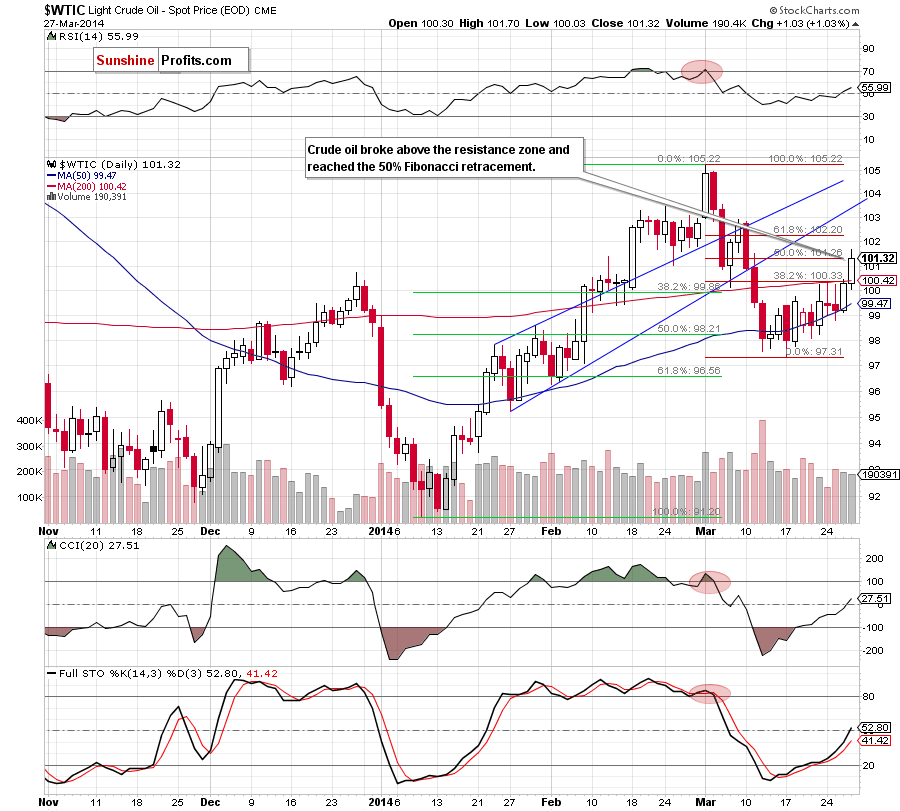
Looking at the above chart, we see that crude oil extended gains and successfully broke above a strong resistance zone created by the 200-day moving average and the 38.2% Fibonacci retracement, which is a strong bullish signal. As you see on the daily chart, with this upswing, light crude reached the next Fibonacci retracement level and closed the day above $101 for the first time since March 7. Additionally, buy signals generated by the indicators remain in place and support oil bulls. Despite these positive circumstances, we should keep in mind that yesterday’s upswing materialized on relative small volume, which questions the power of the buyers. Therefore, if they fail and do not push the price to the 61.8% Fibonacci retracement around $102.20 (the next upside target) later in the day, we will likely see a pullback. If this is the case, the first downside target will be the previously-broken 200-day moving average (currently at $100.24).
Having discussed the current situation in light crude, let’s take a look at WTI Crude Oil (the CFD).
Quoting our last Oil Trading Alert:
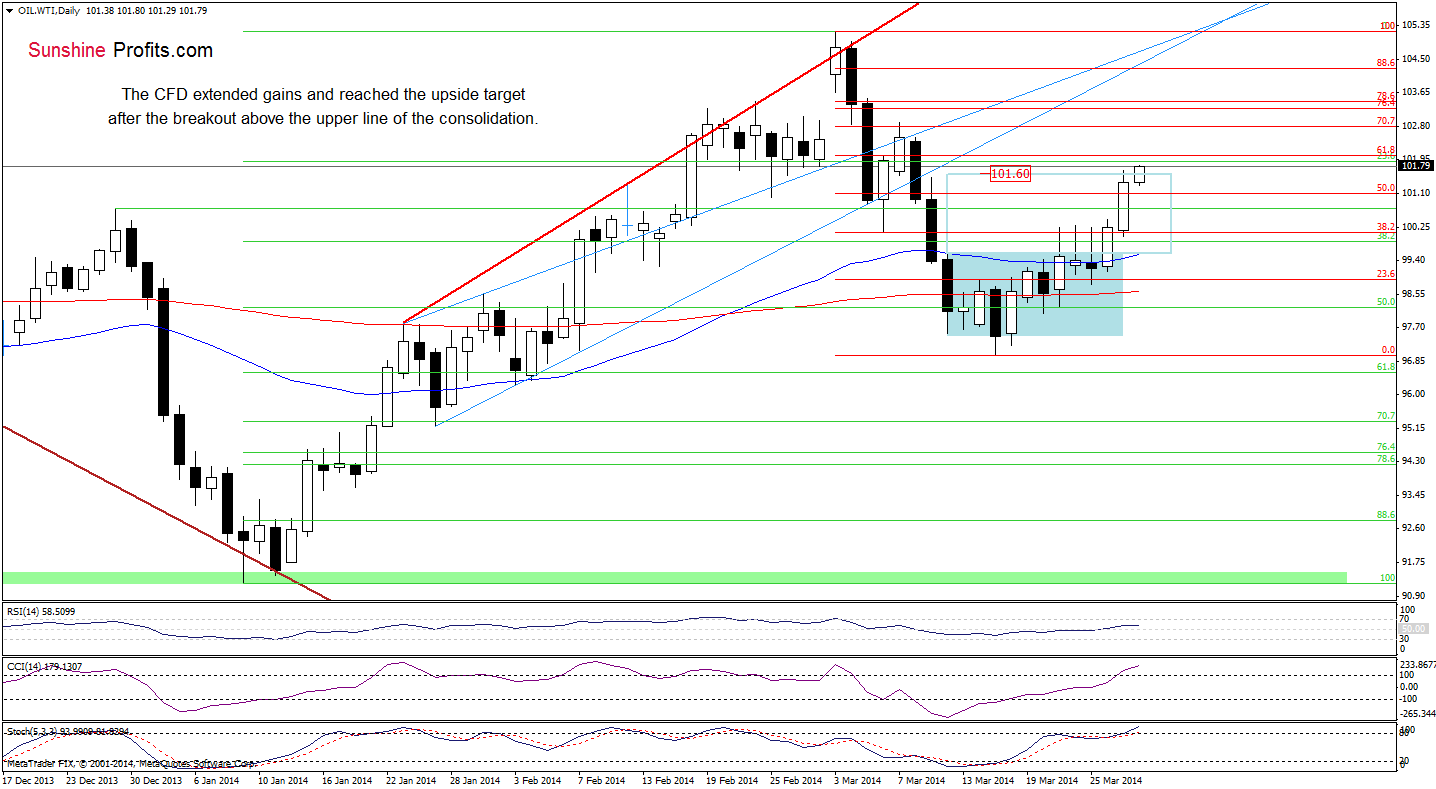
(…) the CFD extended gains and broke above the 50% Fibonacci retracement. Taking this fact into account, it seems that oil bulls will realize a pro growth scenario (after a breakout above the upper line of a consolidation range) and reach the upside target around $101.60. Please note that if the CFD breaks above this level, we will likely see an increase to the 61.8% Fibonacci retracement (around $102).
As you see on the daily chart, WTI Crude Oil reached the first upside target yesterday. This positive event encouraged buyers to act and triggered further improvement earlier today. With this upswing, the CFD extended gains and approached the 61.8% Fibonacci retracement. If this resistance encourages sellers to act, we may see a pullback to the previously-broken 50% Fibonacci retracement. However, if oil bulls do not give up and broke above this level, we will likely see an increase to the 70.7% Fibonacci retracement (around $102.79). Please note that this area is reinforced by the March 7 high.
Before we summarize today’s Oil Trading Alert, we would like to draw your attention to the 4-hour chart of WTI Crude Oil.
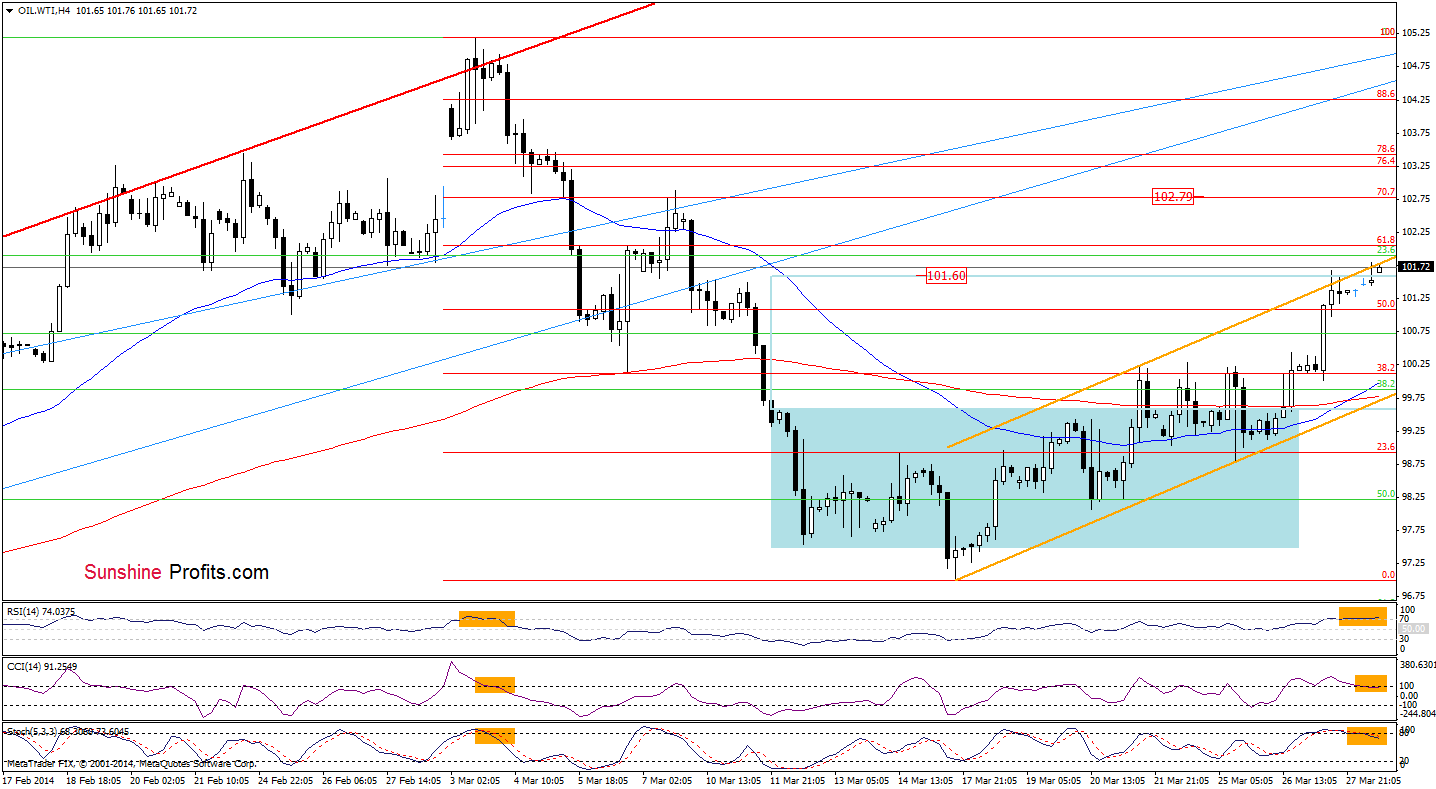
From this perspective, we see that the CFD not only approached the 61.8% Fibonacci retracement, but also reached the upper line of the rising trend channel (marked with orange). If the combination of these two important resistance levels encourages oil bears to act, we will likely see a pullback in the following hours. As you see on the above chart, the position of the indicators supports this bearish scenario at the moment and suggests that a decline is just around the corner. Please note that the RSI is at its highest level since the beginning of March, while the CCI and Stochastic Oscillator generated sell signals (there are also a negative divergences between these two indicators and the price).
Summing up, the short-term situation has improved as crude oil broke above the strong resistance zone. Despite these positive circumstances, yesterday’s upswing materialized on relative small volume, which questions the power of the buyers. Additionally, the current situation in the CFD suggests that a pullback is just around the corner. If this is the case and WTI Crude Oil declines, it will have a negative impact on light crude and we will also see a correction in crude oil.
Very short-term outlook: bullish
Short-term outlook: mixed with bullish bias
MT outlook: bullish
LT outlook: mixed
Trading position (short-term): In our opinion no positions are justified from the risk/reward perspective. We will keep you informed should anything change as far as our opinion is concerned, or should we see a confirmation/invalidation of the above.
Thank you.
Nadia Simmons
Forex & Oil Trading Strategist
Forex Trading Alerts
Oil Investment Updates
Oil Trading Alerts

