
Trading position (short-term): In our opinion no positions are justified from the risk/reward perspective.
On Wednesday, crude oil climbed to another 2014 high as expectations of strong demand for heating fuels refined from crude oil still weighted on the price. In this way, light crude gained 0.28%, finishing the day slightly below $103 per barrel.
As you know from our previous Oil Trading Alerts, colder-than-normal temperatures and winter storms have driven strong demand for heating-related fuels such as heating oil, pushing the price of light crude higher. In the EIA report released last week, inventories of distillates, which include heating oil, were 10% below year-ago levels and 22% below average for this time of year. Therefore, the tight supply picture in combination with new extended weather forecasts (which predict another cold blast across much of the U.S. in the next week to two weeks) weighted on the price also yesterday.
Once we know the major factor boosting the price of light crude, we would like to emphasize that today's alert will be quite specific, because our data providers (or more precisely: chart providers) got a little ahead of themselves and on yesterday's charts (included in yesterday's alert) the price for the $WTIC was slightly higher than it really was. We see that the issue was corrected, but meanwhile crude oil managed to move higher - to where it "supposedly was" yesterday. This means that what we wrote based on yesterday's prices is actually up-to-date today. Consequently, we will quote it below (charts courtesy of http://stockcharts.com.)
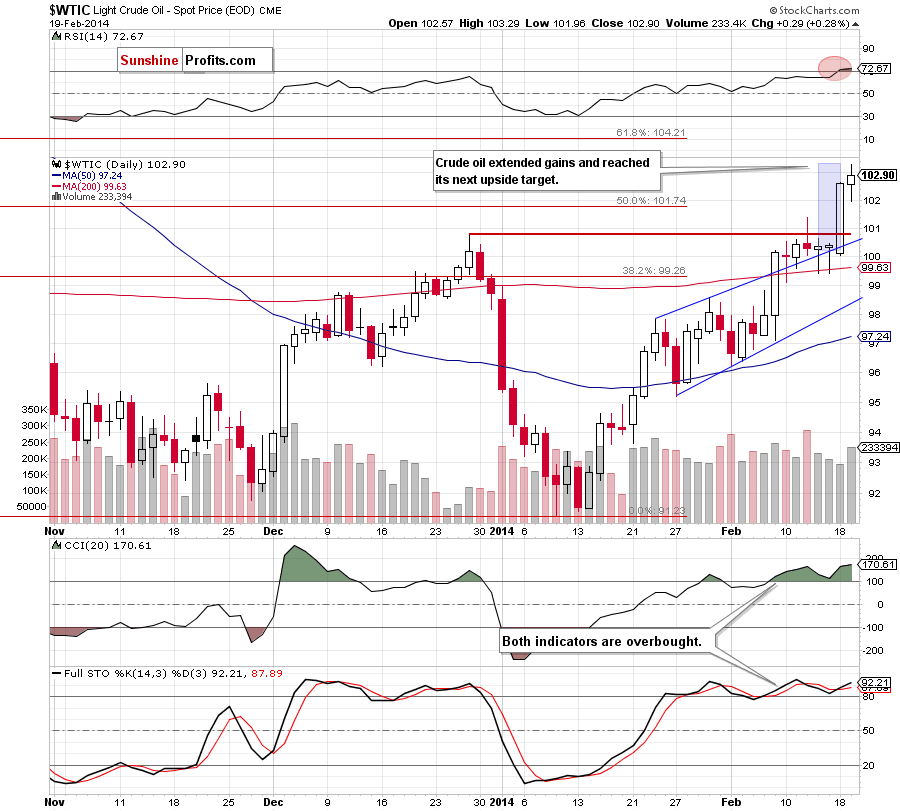
On the above chart, we see that the situation has improved significantly as crude oil bounced off the upper border of the rising trend channel and broke above the December high. With this increase light crude also moved above the previous February high and the 50% Fibonacci retracement level based on the entire Aug.-Jan. decline, which is a bullish sign. (…) as you see on the daily chart, with this growth, crude oil reached its next upside target (marked with a light blue rectangle). At this point, it’s also worth noting that slightly above the current level is the 127.2% Fibonacci extension level (based on the Dec.-Jan. decline), which serves as resistance (around $103.34). On top of that, there is a negative divergence between the Stochastic Oscillator and crude oil, while the CCI and RSI are overbought. Taking all the above into account, it seems that a pause or a pullback is just around the corner.
Before we discuss the current situation in WTI Crude Oil, please note that checking the oil CFD for confirmation is a good idea - while the odds for reliable third party's error on any given chart are very small, the odds for this happening simultaneously on 2 charts are extremely low. Consequently, it pays off to look for confirmations of a given move (as you know, we didn't suggest opening any position based on yesterday's prices). Moving on to the chart itself...
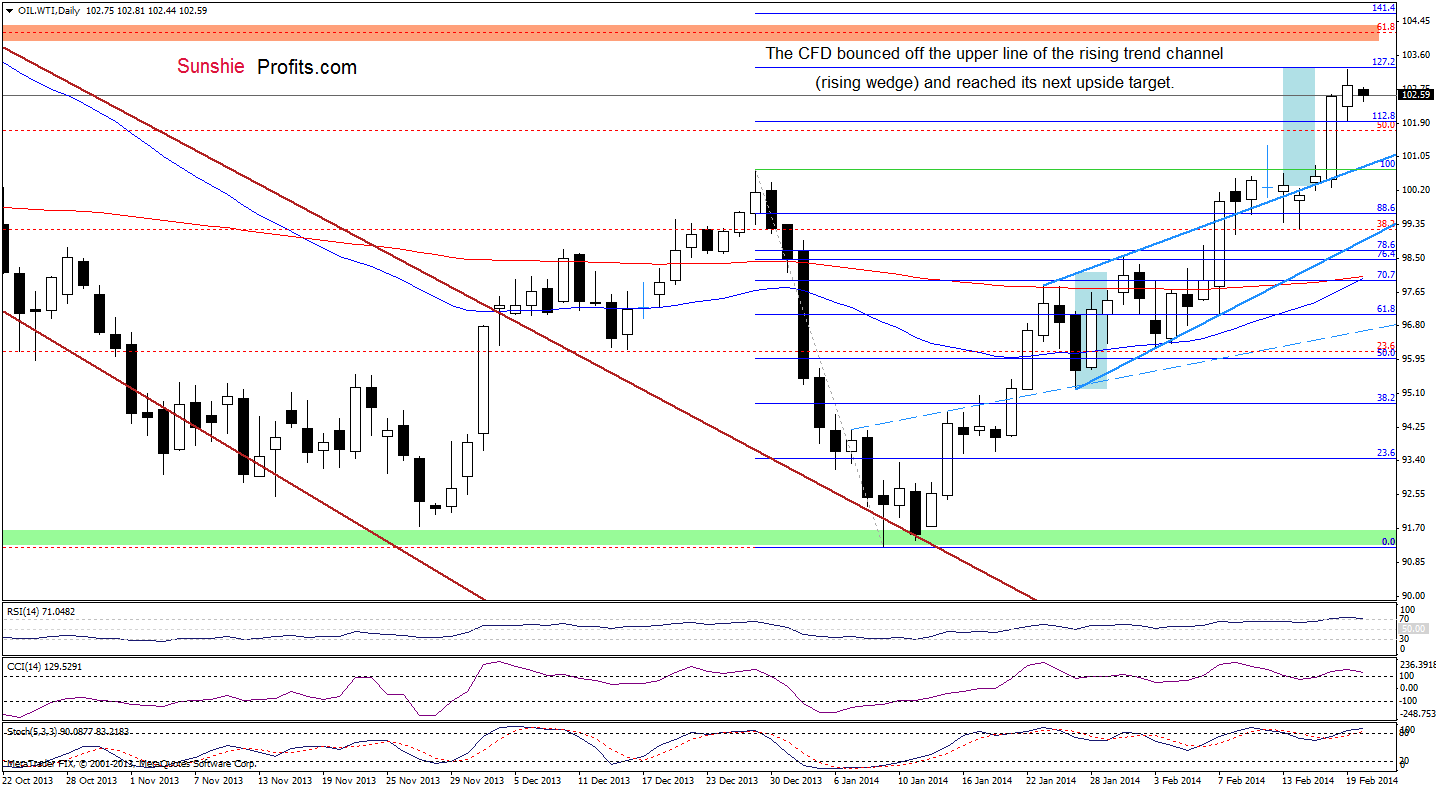
Looking at the above chart, we see that WTI Crude Oil moved higher once again and reached its upside price target (marked with a light blue rectangle), which corresponds to the 127.2% Fibonacci extension level (based on the Dec.-Jan. decline). If this strong resistance encourages sellers to act, we will likely see a pullback in the coming day (or days) and the first important support will be the previously-broken upper border of the rising trend channel/rising wedge. This scenario is currently reinforced by the position of the indicators - the CCI and Stochastic Oscillator are not only overbought, but there are also negative divergences between them and the CFD, while the RSI declined below the level of 70, generating a sell signal, which provides us with bearish implications.
Nevertheless, from this perspective, the situation is still bullish (a current decline is much smaller than the previous one) and if the CFD reverses, the next target for the buyers will be the 61.8% Fibonacci retracement, which corresponds to the October high.
Summing up, the current situation in crude oil has improved significantly as light crude broke above the previous high and hit a fresh 4-month high. However, we should keep in mind that crude oil (and also the CFD) reached the previously-described upside level after the breakout above the upper border of the rising trend channel (which corresponds to the height of the trend channel) and approached the 127.2% Fibonacci extension level, which is a strong resistance level. On top of that, there is a negative divergence between the Stochastic Oscillator and crude oil (which are also visible in the case of the CFD) and the RSI still remains above the level of 70. Connecting the dots, all the above circumstances suggest that a pause or a pullback is just around the corner. Please note that even if crude oil climbs once again, it seems that the space for further growth will be limited by the 61.8% Fibonacci retracement level.
Very short-term outlook: bullish
Short-term outlook: bullish
MT outlook: bullish
LT outlook: mixed
Trading position (short-term): In our opinion, opening long positions at the moment is not a good idea as the space for further growth seems limited and the position of the indicators suggests that we may see a correction in the coming days. We will keep you informed should anything change, or should we see a confirmation/invalidation of the above.
Thank you.
Nadia Simmons
Forex & Oil Trading Strategist
Forex Trading Alerts
Oil Investment Updates
Oil Trading Alerts

