
On Wednesday, crude oil gained 1.76% as better-than expected U.S. economic data and a larger-than-expected drawdown in crude oil inventories pushed the price higher. Thanks to this, light crude came back above $94 per barrel.
Yesterday, data showed that U.S. producer price inflation rose at the strongest rate in six months in December. The U.S. producer price index rose 0.4% last month, (which is the biggest increase since June), recovering from a 0.1% decline in November. Meanwhile, core PPI was up 0.3% in December, compared to expectations for a monthly increase of 0.1%. These stronger-than-expected data fueled expectations that the U.S. economy will continue to recover and will demand more fuel and energy. In reaction to this, as mentioned earlier, light crude extended gains and came back above $94.
Crude oil was also supported by a larger-than-expected drawdown in crude oil inventories. The Energy Information Administration report showed that the U.S. stockpiles in the week ending Jan. 10 fell by 7.66 million barrels to 350.2 million barrels (analysts had expected a drop of only 800,000 barrels). Please note that this is the seventh straight week of crude stockpile declines and the biggest one-week drop since the week ended Dec. 6. Crude inventories as of Jan. 10 are at their lowest level since March 2012.
Having discussed the above, let’s move on to the technical changes in the crude oil market (charts courtesy ofhttp://stockcharts.com.)
Quoting our last Oil Trading Alert:
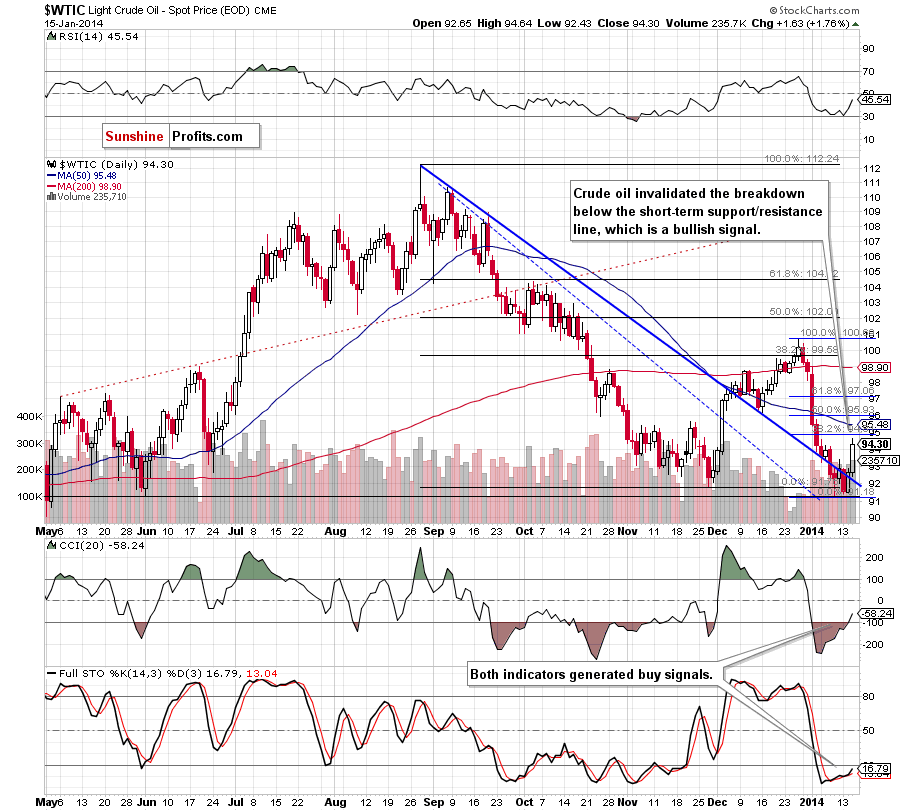
(…) crude oil (…) closed the day just above the previously-broken short-term declining support/resistance line. This is a positive sign, but (…) it seems that we could talk about further improvement after an increase above Friday’s high of $93.38. If we see such price action, a post-double-bottom rally will likely be seen.
Looking at the above chart, we see that crude oil extended gains and bounced off the short-term declining support/resistance line, which is a bullish sign. Additionally, yesterday’s upswing materialized on relatively high volume, which confirms the strength of the buyers. On top of that, the CCI also generated a buy signal (the buy signal generated by the Stochastic Oscillator remains in place).
As you see on the above chart, with this increase, light crude approached the 38.2% Fibonacci retracement level. On one hand, this resistance may encourage sellers to act and result in a pullback in the coming day (or days). On the other hand, if the buyers push the price above this level, we will likely see further improvement and the first upside target will be the previously broken 50-day moving average.
Before we discuss the current situation in the CFD, we would like to take a look at the weekly chart, which gave us interesting clues in the past.
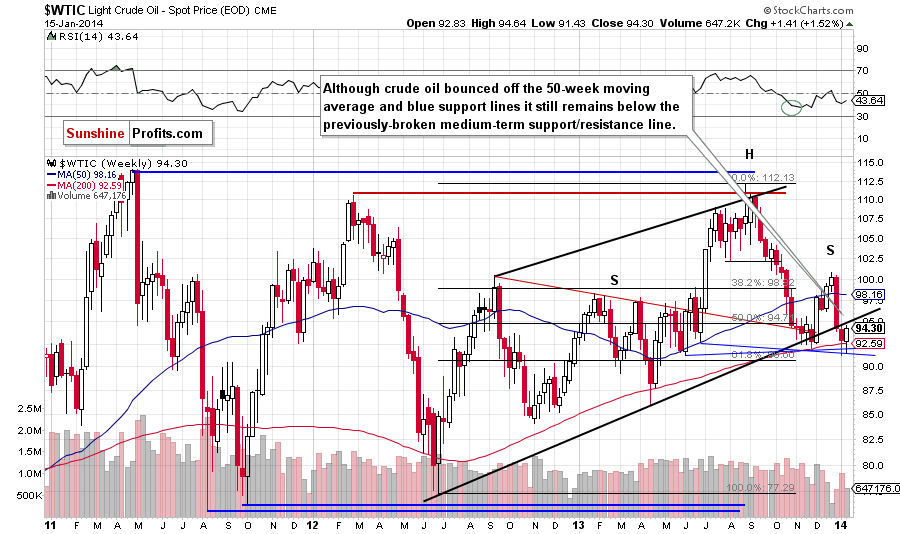
On the above chart, we see that despite yesterday’s improvement crude oil still remains below the previously-broken medium-term support/resistance line. From this perspective, it seems justified to wait for an invalidation of the breakdown before opening long positions.
Having discussed the current situation in light crude, let’s take a look at WTI Crude Oil (the CFD).
In our last Oil Trading Alert, we wrote:
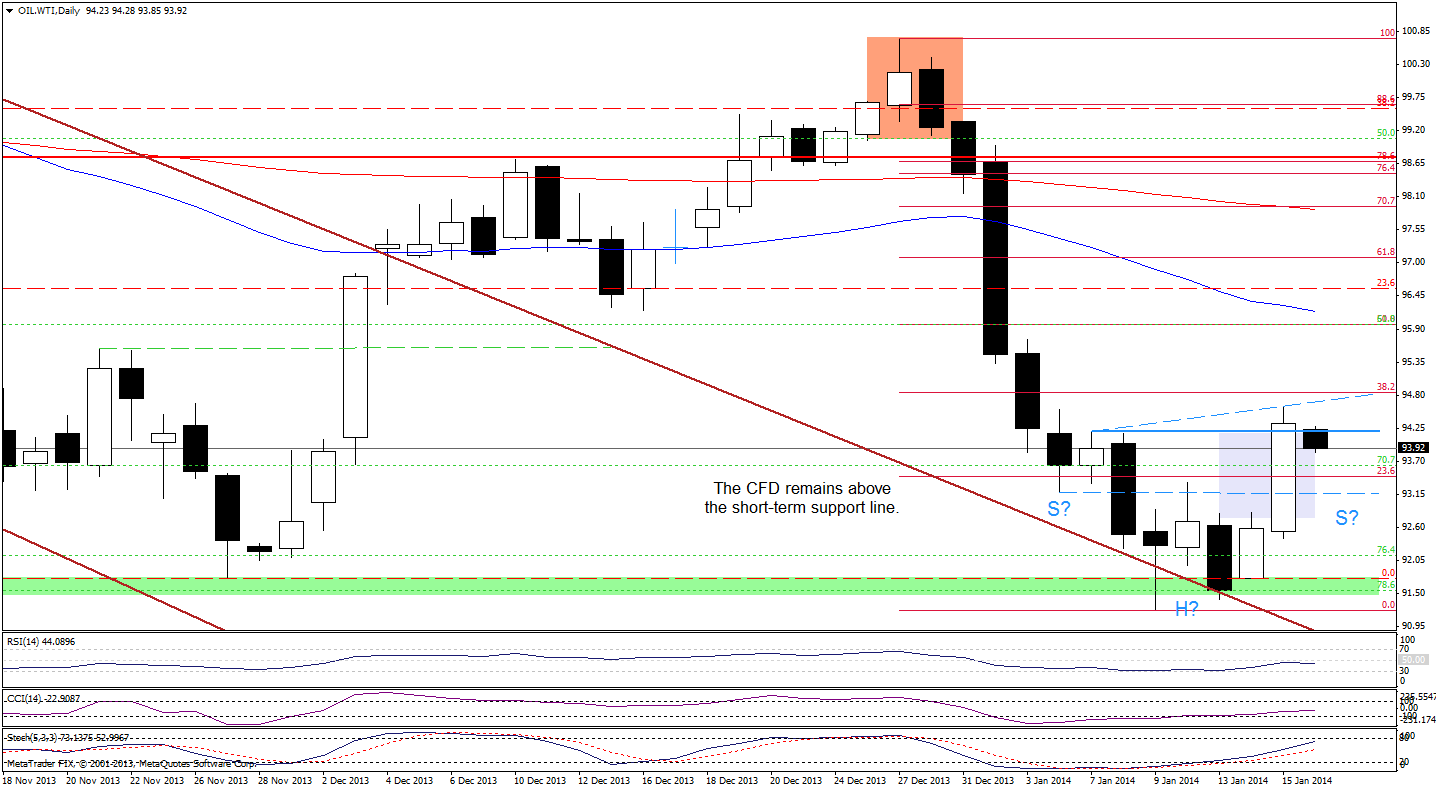
(…) recent days have formed a consolidation, which may be a signal of further improvement. According to theory, if the CFD climbs above $92.83, we will likely see an upswing to around $94.16. It seems that this price action will be more likely if WTI Crude Oil breaks above Friday’s high of $93.35.
On the above chart, we notice that we saw such price action yesterday. After a breakout above the upper line of a consolidation range, WTI Crude Oil extended gains and broke above Friday’s high. This positive event triggered further improvement and the CFD reached its first upside target. Although WTI Crude Oil approached the 38.2% Fibonacci retracement level, the buyers didn’t manage to push the price higher.
As you see on the daily chart, the proximity to this resistance encouraged sellers to act and resulted in a small decline. From today’s point of view an upward corrective move is quite shallow and a pullback in the coming day (or days) should not surprise us. At this point, it’s worth noting that if we see such price action and the CFD rebounds (after a drop to around $93.19), we will likely see a reverse head and shoulders formation, which would be a strong bullish signal.
On the other hand, if the buyers manage to push the CFD higher and we see a breakout above the 38.2% Fibonacci retracement in the coming day (or days), the situation will improve significantly and we will likely see an upward move to around $95.97 where the next Fibonacci retracement is.
Once we know the above, let’s take a look at the NYSE Arca Oil Index (XOI) chart.
In our previous Oil Trading Alert, we wrote the following:
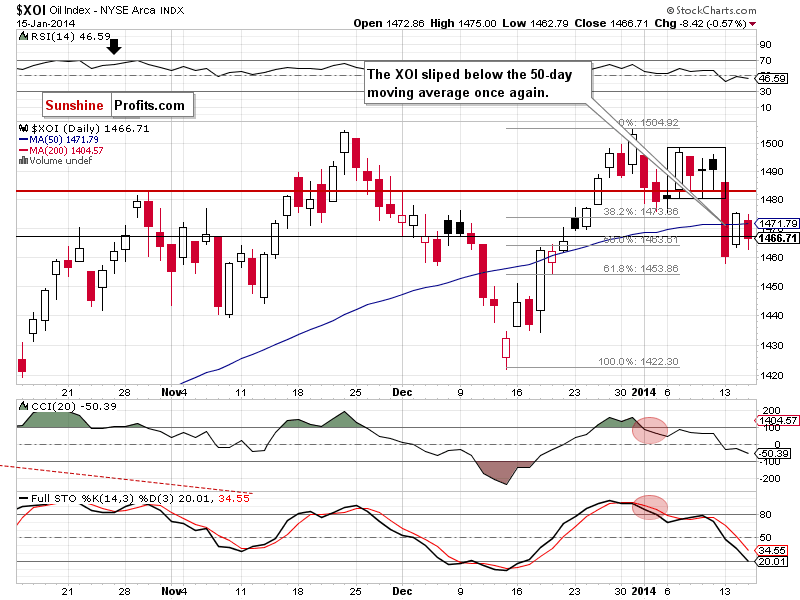
(…) the XOI invalidated the breakdown below the 50-day moving average, which is a positive signal. Nevertheless, it still remains not only below the lower border of the consolidation range, but also previous January low. Additionally, sell signals generated by the CCI and Stochastic Oscillator remains in place supporting the bearish case. Taking these facts into account, further deterioration should not surprise us.
Looking at the above chart, we see that despite Tuesday’s invalidation of the breakdown the buyers didn’t take their chance. Although we saw an attempt to move higher after the market open, the XOI quickly gave up (small) gains and reversed, which triggered a downswing that took the index below the 50-day moving average once again. This is a bearish signal, which will likely encourage sellers to act. If this is the case, the first support level will be Monday’s low and the next will be the 61.8% Fibonacci retracement level around 1,453.
Summing up, crude oil extended its increase and approached the 38.2% Fibonacci retracement level. Therefore, if light crude breaks this resistance, we may see further increases (which will likely accelerate if crude oil invalidates the breakdown below the medium-term support/resistance line – currently around $94.70). On the other hand, this resistance may encourage sellers to act (similarly to what we saw in December as crude oil increased slightly above the 38.2% Fibonacci retracement based on the entire Aug. - Nov. decline). Connecting the dots, it seems that the situation is too unclear at the moment to open long positions.
Very short-term outlook: bullish
Short-term outlook: mixed
MT outlook: mixed
LT outlook: mixed
Trading position (short-term): We do not suggest opening any positions at the moment. We will keep you informed should anything change, or should we see a confirmation/invalidation of the above.
Thank you.
Nadia Simmons
Forex & Oil Trading Strategist
Oil Investment Updates
Oil Trading Alerts

