
On Tuesday, crude oil declined once again and hit a fresh monthly low of $92.43 as concerns about rising U.S. inventories and uncertainty over the duration of the Federal Reserve’s stimulus program weighed on price. Despite this drop, light crude reversed course after Bernanke's comments and on hopes of higher U.S. oil demand. Finally, crude oil gained 0.41% and closed the day above $93 per barrel.
Yesterday, growing concerns about rising U.S. inventories and ongoing uncertainty over the duration of the Federal Reserve’s stimulus program pushed crude oil to its fresh monthly low. However, Bernanke's comments late on Tuesday that indicated any stimulus tapering was unlikely to occur in the near term helped to support the price of light crude. Bernanke said that the Fed will maintain its ultra-easy U.S. monetary policy for as long as needed and will only begin to taper bond-buying once it is assured that labor market improvements would continue.
Please note that data from industry group the American Petroleum Institute showed on Tuesday that crude inventories rose 512,000 barrels in the week ended Nov. 15 and refinery runs rose 1.2 percentage points to 88.1% of capacity.
Today, the U.S. Energy Information Administration's weekly release of data on petroleum inventories expected to show a ninth straight week of increases amid strong domestic production. Analysts are expecting a rise of 700,000, which would bring U.S. inventories to 388.8 million barrels - an increase of 33 million barrels, or 9.3%, in nine weeks. If we see such (or lower) increase, the price of light crude will likely move higher. However, if the data is better-than-expected, crude oil will probably re-test yesterday’s low.
Having discussed the above, let’s move on to the technical changes in the crude oil market (charts courtesy of http://stockcharts.com).
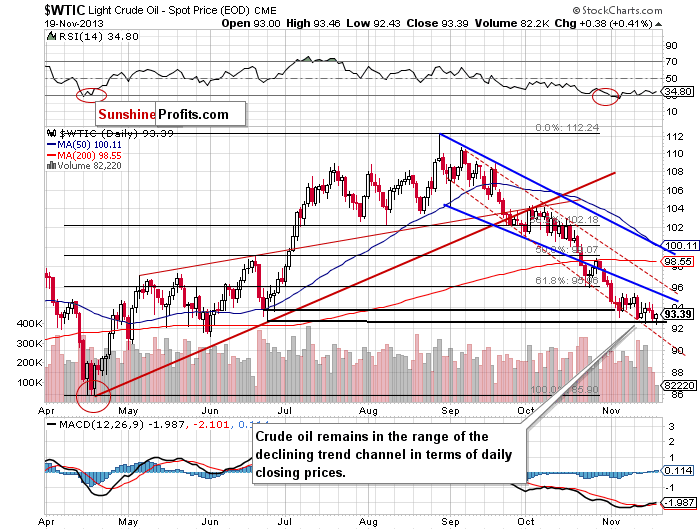
Yesterday, after the market open crude oil moved lower and hit a fresh monthly low of $92.43. With this downward move, light crude slipped below the bottom of the corrective move that we saw back in June (in terms of intraday lows) once again. However, this deterioration was only temporary. Crude oil reversed course and rose in the following hours to its daily high of $93.46. In this way, the breakdown below the support level was invalidated, but Tuesday’s upswing materialized on tiny volume, which is not as bullish as it may seem at first sight.
Please note that despite this drop, crude oil remains in the range of the declining trend channel in terms of daily closing prices (marked with the red dashed line).
The nearest support is the November low – slightly below the bottom of the corrective move that we saw back in June (in terms of intraday lows). The next one is the lower border of the declining trend channel (currently around $91.30).
The first resistance level is the Nov. 15 high and the next one is the Nov. 11 high, which intersects with the lower border of the declining trend channel in terms of intraday lows (marked with the blue bold line).
Once we know the current situation in crude oil, let’s move on to the XOI daily chart.
Quoting our previous Oil Trading Alert:
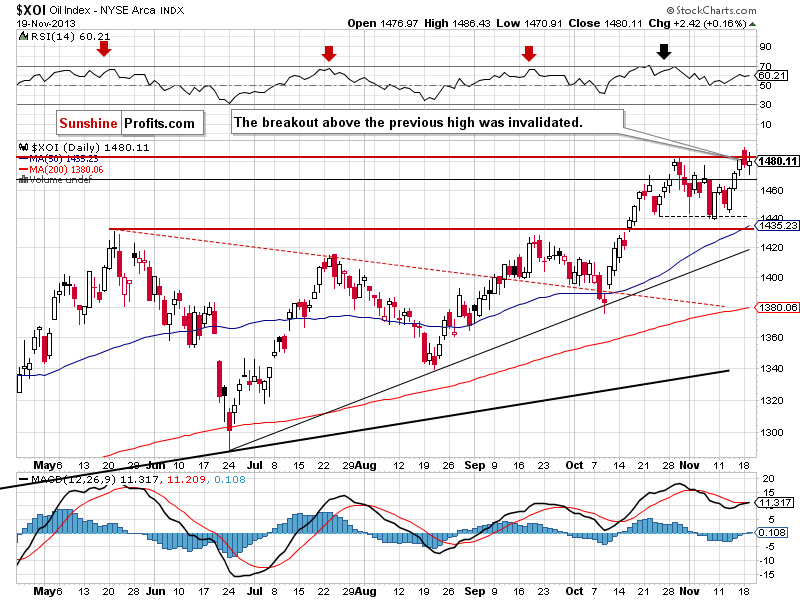
(…) the upper line of the smaller rising wedge on the weekly chart, which successfully stopped growth at the end of October, is still in play. Despite yesterday’s growth, the XOI remains below this line, which serves as strong resistance (currently around 1,495). Therefore, we should keep an eye on the oil stock index because the sellers may lock profits and trigger another correction in the coming days.
As you can see on the above chart, yesterday after the open, the XOI extended declines and dropped to its daily low at 1,470. However, after this decrease, the oil stock index reversed course and rebounded in the following hours. Yesterday’s pullback took the XOI to slightly below the 2013 high, but this resistance stopped further growth and the oil stock index still remains below the previous annual high.
We can see a double top on the daily chart. If the buyers do not push the XOI higher, this bearish pattern may encourage sellers to act and result in a corrective move – especially when we take into account the upper line of the smaller rising wedge, which is a strong resistance.
Keep in mind that the nearest support zone is created by last Wednesday’s low and the bottom of the recent corrective move (between 1,439 and 1,444).
Summing up, although the situation has deteriorated slightly and crude oil hit a new monthly low, it still remains in the declining trend channel in terms of daily closing prices and the long-, medium- and short-term support levels are still in play.
Very short-term outlook: bearish
Short-term outlook: bearish
MT outlook: bearish
LT outlook: unclear
Trading position (short-term): Taking into account the medium- and short-term picture, we do not suggest opening any positions.
Thank you.
Nadia Simmons
Sunshine Profits' Crude Oil Expert
Oil Investment Updates
Oil Trading Alerts

