
Trading position (short-term): no positions.
On Monday, crude oil lost 1.31% as data showed that U.S. new home sales dropped more-than-expected in the previous month, fueling concerns over the economic outlook. Thanks to this news, light crude declined and closed the day slightly below $96 per barrel.
Yesterday, the U.S. Commerce Department said that new home sales dropped by 7% to a seasonally adjusted 414,000 units last month, missing expectations for an increase to 457,000. These numbers were also below November's revised figure of 445,000, which damped optimism over the economic outlook and fueled concerns that demand for crude oil could weaken.
Please note that investors are looking ahead to the outcome of the Federal Reserve’s monthly meeting on Wednesday. Federal Reserve officials will consider whether to continue to wind down the central bank's stimulus measures at a meeting Tuesday and Wednesday. It seems that market participants worry that reducing the stimulus measures would have the opposite effect, strengthening the dollar and weighing on the price of oil, which is denominated in dollars.
Nevertheless, we should keep in mind that in December the Fed said it would begin scaling back its monthly bond purchases this month, but we didn’t see sharp declines in crude oil as the dollar strengthened on the news.
Having discussed the above, let’s move on to the technical changes in the crude oil market (charts courtesy of http://stockcharts.com.)
In our last Oil Trading Alert, we wrote:
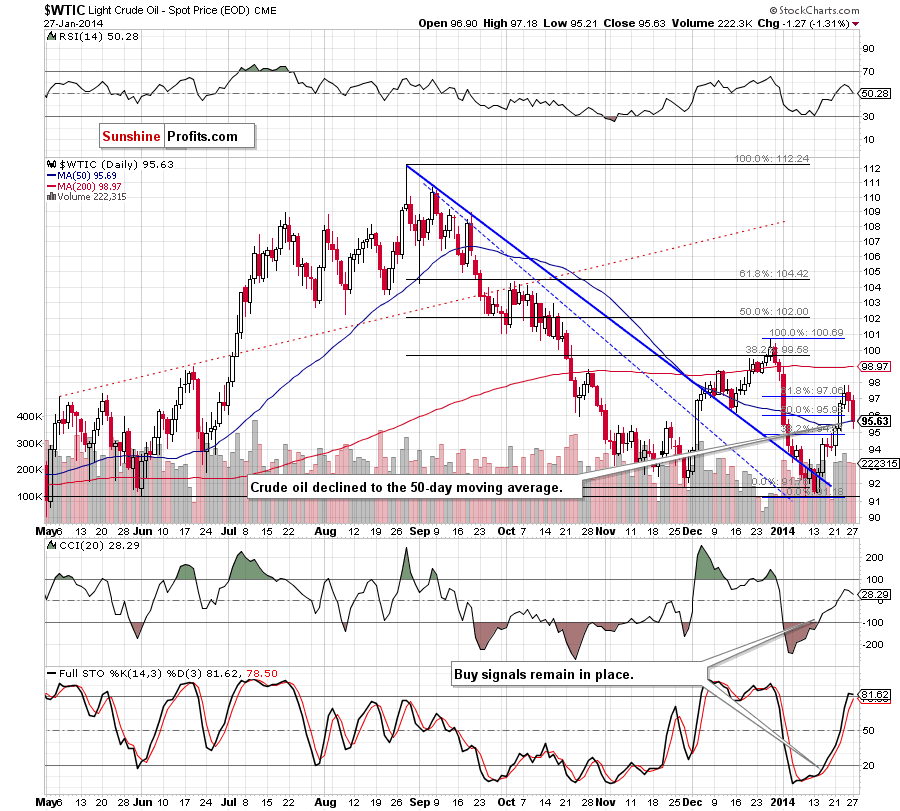
(…) light crude declined below the 61.8% Fibonacci retracement level and invalidated the breakout above this resistance level, which is not a positive sign. Despite this drop, (…) the very short-term uptrend is not threatened and further improvement after a pullback (which seems not over yet) is likely to be seen.
On the above chart, we see that crude oil extended declines and dropped to the 50-day moving average. With this downward move, light crude also reached the 38.2% Fibonacci retracement level based on the recent rally (at $95.32). If this strong support zone encourages oil bulls to act, we will likely see an upward corrective move in the near future. Please note that this scenario is reinforced by the position of the indicators (they are not overbought at the moment and buy signals remain in place supporting buyers).
Nevertheless, if the buyers fail and the price drops lower, the next downside target will be around $93.65 where the Jan.21 low is.
Having discussed the current situation in light crude, let’s take a look at WTI Crude Oil (the CFD).
Quoting our last Oil Trading Alert:
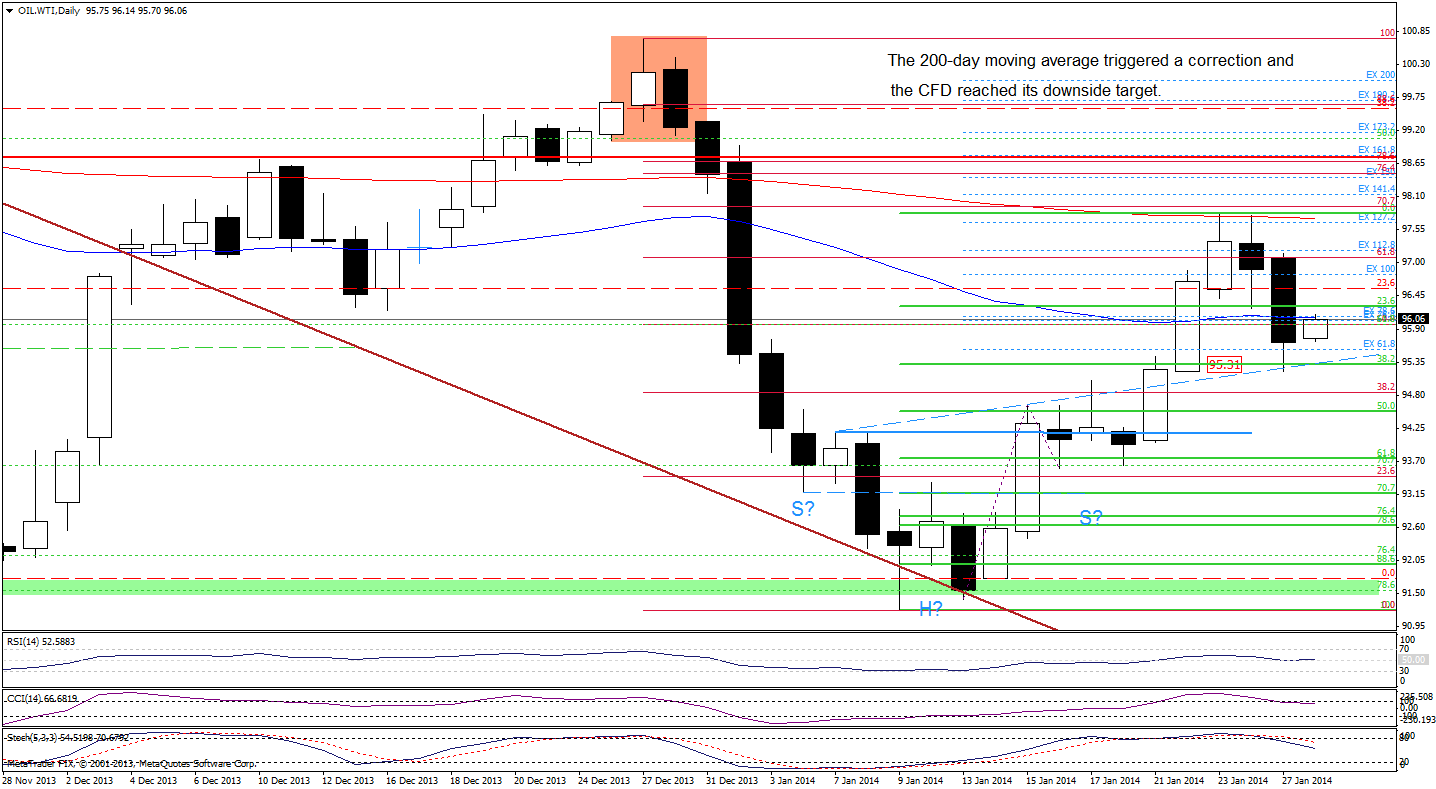
(…) recent days have formed a consolidation. (…) if the price declines below the 50-day moving average, we will likely see a drop to around the 38.2% Fibonacci retracement level based on the recent rally at $95.31. Please note that taking into account the strong resistance zone and the position of the indicators (the CCI and Stochastic Oscillator are overbought and very close to generating sell signals), the latter scenario is more likely.
Looking at the above chart, we see that WTI Crude Oil extended declines and oil bears realized their own scenario yesterday. As you see on the above chart, a breakdown below the 50-day moving average triggered further deterioration and the CFD dropped to the 38.2% Fibonacci retracement which intersects with the blue dashed support line. Although this support levels encouraged buyers to act, the price still remains below the 50-day moving average which serves as resistance now (at least when these words are written). If it is broken, we will likely see further improvement and the first upside target will be yesterday’s high.
Nevertheless, taking into account sell signals generated by the indicators and the fact that the CFD remains below the 50-day moving average, we may see another attempt to move lower
Summing up, crude oil extended declines and dropped to the 50-day moving average and the 38.2% Fibonacci retracement level. As mentioned earlier, if this strong support zone encourages oil bulls to act, we will likely see an upward corrective move in the near future. Please note that an additional confirmation of the bullish scenario would be a breakout above the 50-day moving average in the case of the CFD.
Very short-term outlook: mixed
Short-term outlook: bullish
MT outlook: bullish
LT outlook: mixed
Trading position (short-term): We do not suggest opening any positions at the moment. We will keep you informed should anything change, or should we see a confirmation/invalidation of the above.
Thank you.
Nadia Simmons
Forex & Oil Trading Strategist
Forex Trading Alerts
Oil Investment Updates
Oil Trading Alerts

