
On Tuesday, crude oil lost 0.50% as profit taking and expectations for an increase in Libyan oil exports pushed the price lower. With this drop, light crude slipped below $99 per barrel.
In our previous Oil Trading Alert we wrote the following:
(…) Libya's national oil company, the Arabian Gulf Oil Co., announced on its website on Monday that it had resumed some oil field and refinery operations the day before, which added selling pressure.
As it turned out, expectations for Libyan oil exports to resume to near normal levels weighted on the price of light crude also on Tuesday due to the added supply they'd bring to the global market.
Meanwhile, it seems that oil investors shrugged off U.S. consumer confidence data. Although they were solid, they didn’t boost the commodity. As a reminder, the Conference Board reported that its index of U.S. consumer confidence improved to 78.1 in December from 72.0 in November, beating consensus forecasts for a 76.0 reading.
The Standard & Poor’s/Case-Shiller 20-city home price index rose at an annualized rate of 13.6% in October from a year earlier, the strongest pace since February of 2006 and above forecasts for an increase of 13.0%.
Additionally, industry data revealed that the Chicago purchasing managers’ index fell to a seasonally adjusted 59.1 this month from 63.0 in November, while analysts expected the index to decline to 61.0 in December.
Also on Tuesday, the American Petroleum Institute said that U.S. crude inventories fell by 5.7 million barrels in the week ended December 27, while the more closely-watched numbers from the U.S. Energy Information Administration have been delayed until Friday due to the New Year’s holiday. Please note that U.S. oil inventories are expected to have fallen by 2.2 million barrels in the week ended Dec. 27.
Today, oil investors are awaiting data from the U.S. Institute of Supply Management, which will release its manufacturing PMI later in the session and the Labor Department’s weekly report on initial jobless claims. Additionally, the U.S. will also publish data on construction spending.
Having discussed the above, let’s move on to the technical changes in the crude oil market (charts courtesy of http://stockcharts.com).
Quoting our previous Oil Trading Alert:
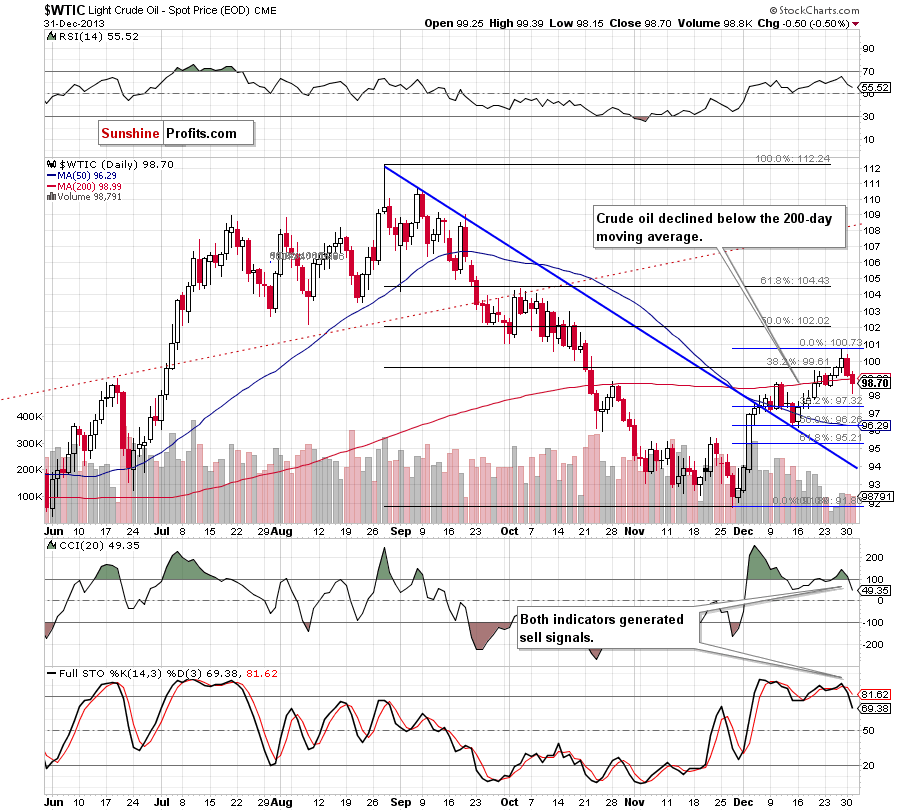
(…) the situation has deteriorated slightly as crude oil invalidated breakouts above the 38.2% Fibonacci retracement level and the psychological barrier of $100. An invalidation of the breakout is a bearish signal by itself, therefore, we could see a correction in the coming day (or days) (…) light crude declined, but it still remains above the previously-broken 200-day moving average. If this support is broken, the first downside target will be around $98.53 where the Dec. 24 low is.
Looking at the above chart, we see that oil bears pushed the price below the 200-day moving average, which triggered a downswing that took crude oil to its daily low of $98.15. In this way, the sellers reached their first downside target. Although crude oil rebounded in the following hours, it still remains below the 200-day moving average. Additionally, the CCI and Stochastic Oscillator generated sell signals, which is a bearish signal, therefore, further deterioration should not surprise us.
Please note that the nearest support is around $97.30 where the 38.2% Fibonacci retracement level based on the entire Nov.-Dec. rally is.
Having discussed the current situation in crude oil, let’s take a look at WTI Crude Oil (the CFD).
Quoting our last Oil Trading Alert:
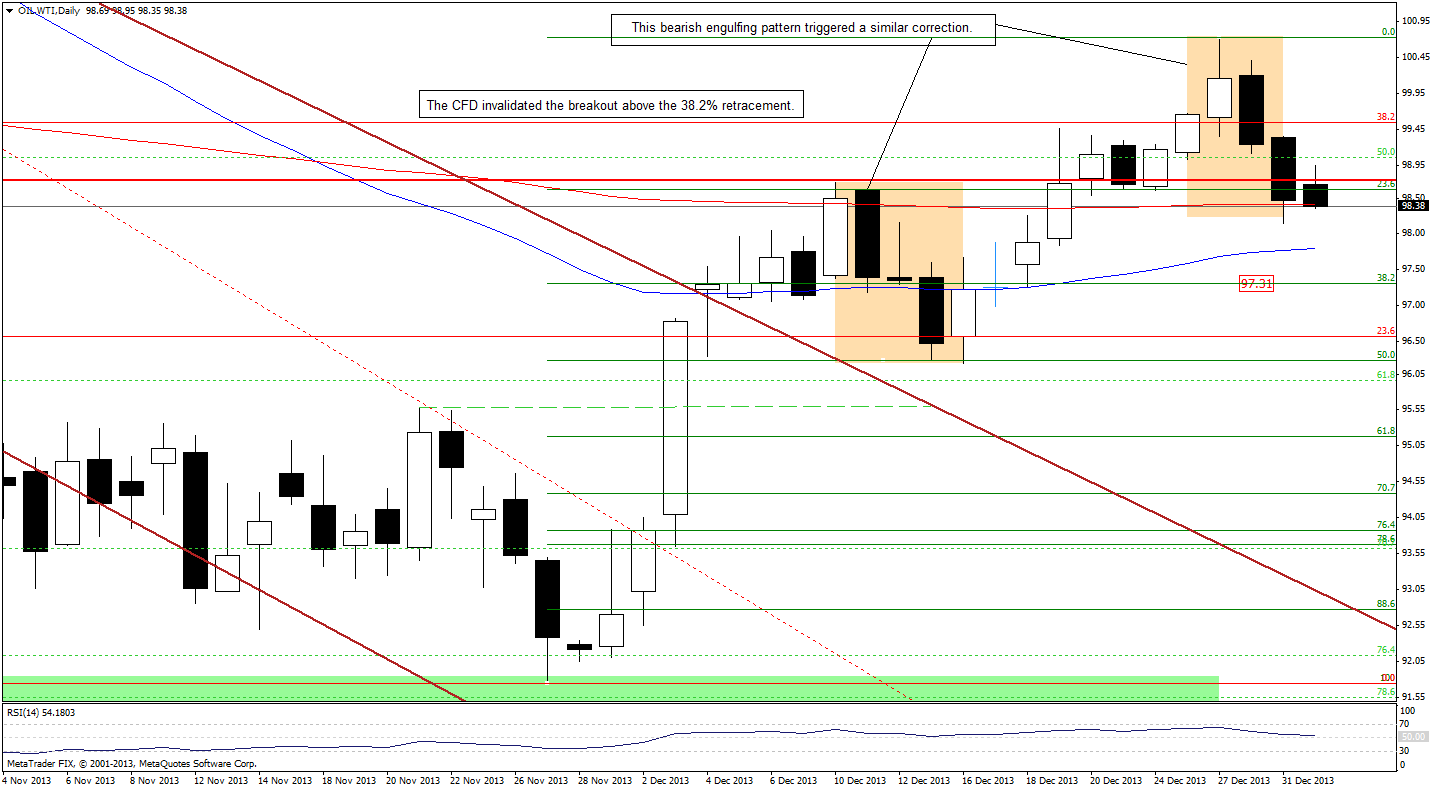
(…) WTI Crude Oil invalidated breakouts above the 38.2% Fibonacci retracement level and the psychological barrier of $100, which is a bearish signal. Additionally, we have a bearish engulfing pattern, which will likely encourage oil bears to trigger a corrective move in the near future. If we see such price action, the first downside target will be the 200-day moving average (currently at $98.42). If it is broken, the next target for the sellers will be the 38.2% Fibonacci retracement level based on the entire Nov.-Dec. rally around $97.30.
On the above chart, we see that the sellers pushed the CFD below the 200-day moving average on Tuesday and reached their first downside target. Although we saw an upswing earlier today, it didn’t change much because it didn’t even erase Tuesday’s drop. As you see on the above chart, the current correction in similar to the previous one. However, if oil bears show their claws once again and the price drops below the Tuesday’s low, we will likely see further deterioration and a downward move to the next downside target - the 38.2% Fibonacci retracement level based on the entire Nov.-Dec. rally around $97.30.
Once we know the above, let’s take a look at the NYSE Arca Oil Index (XOI) chart.
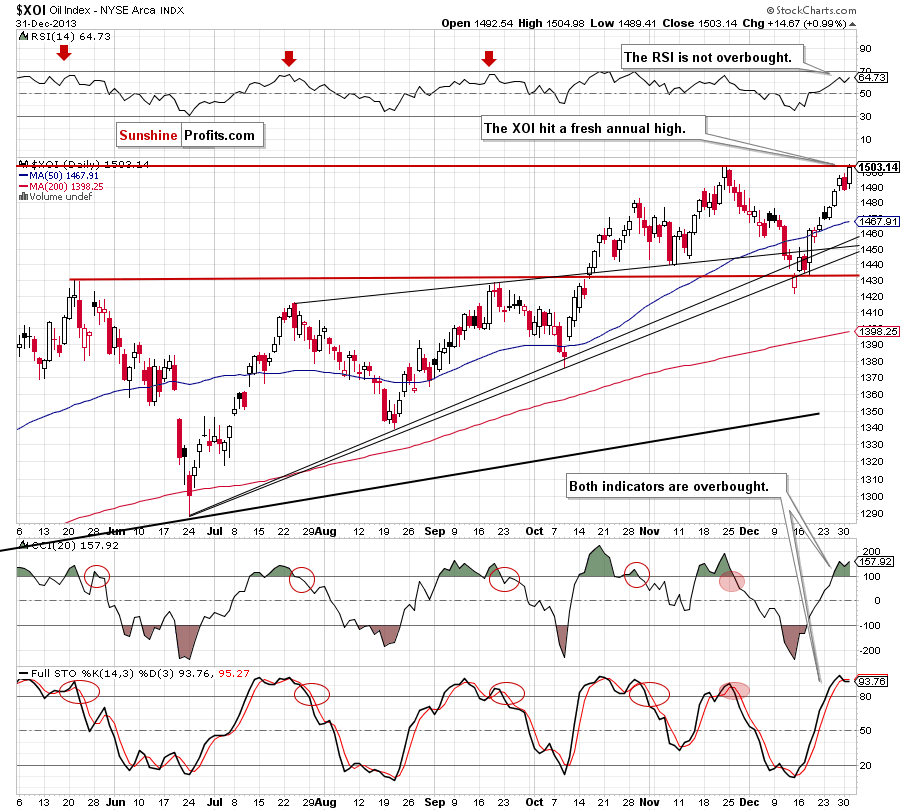
Looking at the above chart, we see that the situation has improved significantly as the XOI extended gains and hit a fresh annual high at 1,504.98. With this upswing, the oil stock index invalidated a bearish engulfing pattern, which is a positive sign. Nevertheless, we should keep in mind that the CCI and Stochastic Oscillator are overbought and the latter generated a sell signal, which may encourage sellers to act.
Before we summarize today’s Oil Trading Alert, we would like to draw your attention to the weekly XOI chart.
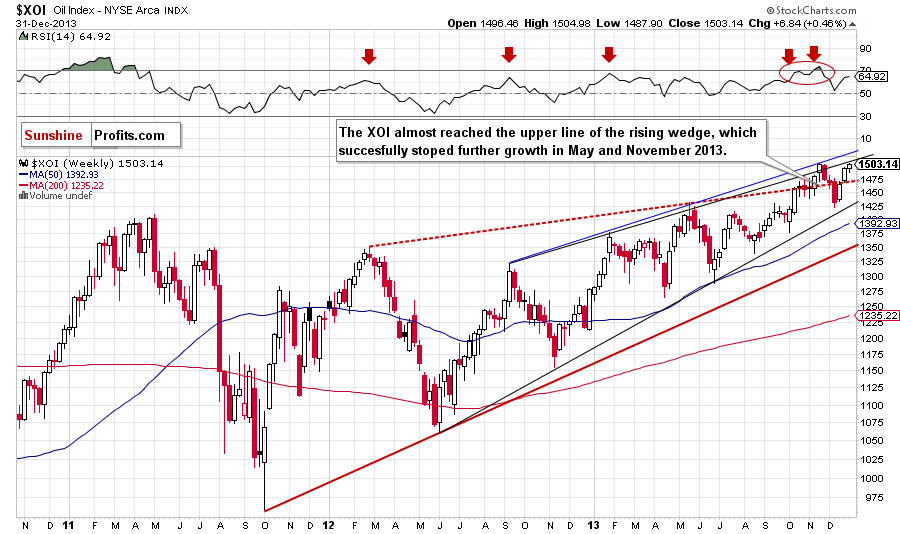
As you see on the above chart, the oil stock index almost reached the upper line of the rising wedge, which successfully stopped further growth in 2013. If history repeats itself once again, we may see similar price action to the one we saw in the previous year. On the other hand, if this line is broken, we will likely see another upswing to the blue medium-term rising resistance line, which stopped an upward move in November 2013.
Summing up, after an invalidation of breakouts above the 38.2% Fibonacci retracement level and the psychologically important level of $100, crude oil slipped below 200-day moving average, which is another bearish signal. Although the current correction is similar to the corrective move that we saw in the previous month, it seems that the above, in combination with the long-term declining resistance line and sell signals generated by two indicators, will likely trigger a bigger correction in the coming days.
Very short-term outlook: bearish
Short-term outlook: mixed
MT outlook: bullish
LT outlook: mixed
Trading position (short-term): We do not suggest opening any positions at the moment. We will keep you informed should anything change, or should we see a confirmation/invalidation of the above.
Thank you.
Nadia Simmons
Forex & Oil Trading Strategist
Oil Investment Updates
Oil Trading Alerts

