
On Tuesday, crude oil gained 1.23% as U.S. retail sales and core retail sales suggested continued improvement in the U.S. economy boding well for demand. Thanks to this news, light crude rebounded closing day above $92 per barrel.
Yesterday, the Commerce Department said that U.S. retail sales rose 0.2% last month (beating expectations for a 0.1% increase), while core retail sales, which exclude automobile sales, climbed 0.7% in December (above forecasts for a 0.4% increase).
These stronger-than-expected data fueled expectations that the U.S. economy continues to recover and will demand more fuel and energy. In reaction to this, as mentioned earlier, light crude rebounded and came back above $92.
Crude oil has also been supported by the expectation that today’s report from the U.S. Energy Information Administration will show that oil supplies declined by 800,000 barrels last week. If the estimate is correct, domestic stockpiles of roughly 357 million barrels will be at their lowest level since mid-September.
As a reminder, declining crude oil inventories have been supporting for WTI over the past six weeks. However, taking into account the fact that oil companies typically move crude from storage tanks at the end-of-year period to avoid a tax, it seems that market participants will be very closely watching this report.
Before we move to the technical part of today’s Oil Trading alert, please note that the American Petroleum Institute said its own supply data for the week ended Jan. 10 showed that crude inventories fell by 4.1 million barrels.
Having discussed the above, let’s move on to the technical changes in the crude oil market (charts courtesy of http://stockcharts.com.)
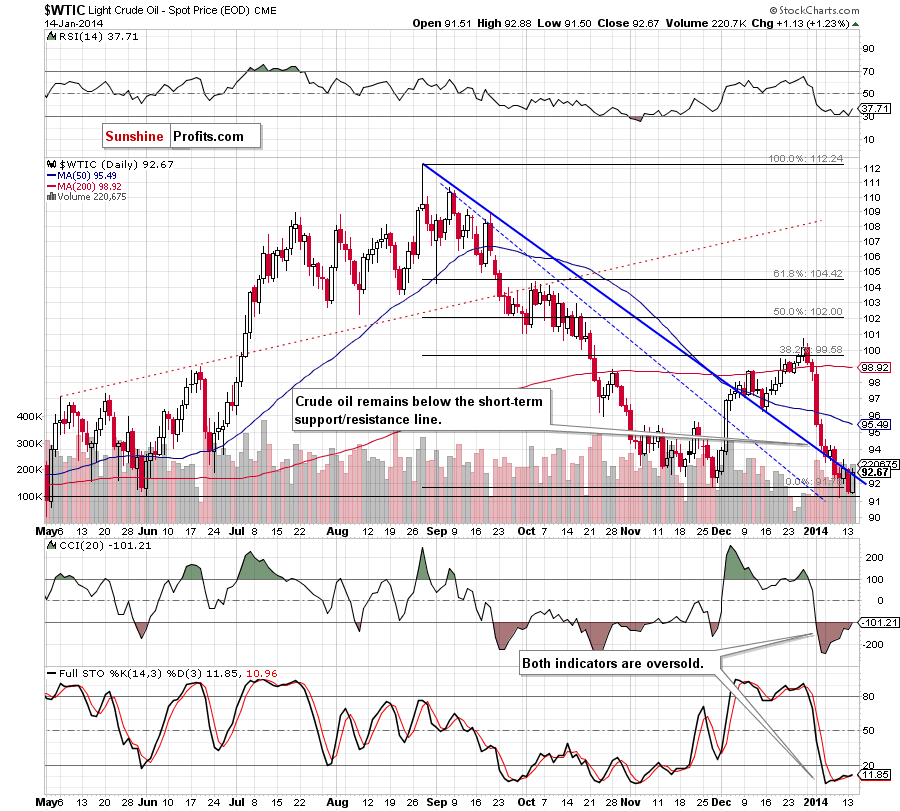
On the above chart, we see that crude oil erased most of Monday’s losses and closed the day just above the previously-broken short-term declining support/resistance line. This is a positive sign, but from today’s point of view, it seems that we could talk about further improvement after an increase above Friday’s high of $93.38. If we see such price action, a post-double-bottom rally will likely be seen.
Quoting our previous Oil Trading Alert:
(...) this assumption is reinforced by the position of the indicators at the moment. The RSI remains close to the level of 30, while the CCI and Stochastic Oscillator are oversold (a buy signal remains in place). Additionally, there are positive divergences, which is a positive sign and may encourage oil bulls to act in the coming day (or days).
Having discussed the current situation in light crude, let’s take a look at WTI Crude Oil (the CFD).
In our last Oil Trading Alert, we wrote:
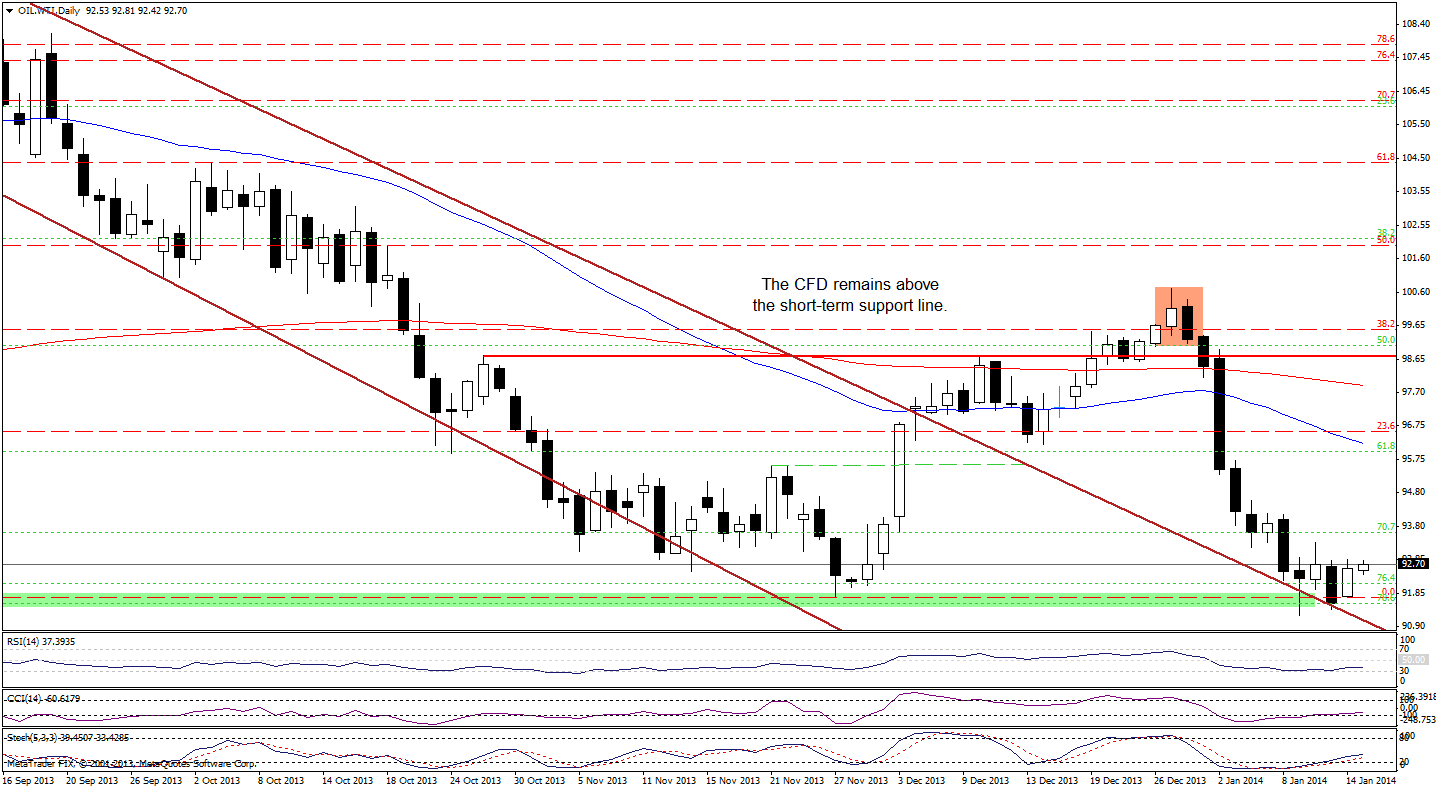
(...) oil bears re-tested the strength of the short-term declining support line once again. Although WTI Crude Oil gave up the gains and declined yesterday, it still remains above this line and the January low, which is a positive sign. Additionally, when we factor in the position of the indicators, we see that the RSI still remains slightly above the level of 30, which suggests that a pause or an upward correction is just around the corner. On top of that, buy signals generated by the CCI and Stochastic Oscillator remain in place, which may encourage oil bulls to act in the near future.
Looking at the daily chart, we see that oil bulls managed to push the price higher and paused the recent decline, but it is still too early to say that the recent correction is over. Nevertheless, as you see on the above chart, recent days have formed a consolidation, which may be a signal of further improvement. According to theory, if the CFD climbs above $92.83, we will likely see an upswing to around $94.16. It seems that this price action will be more likely if WTI Crude Oil breaks above Friday’s high of $93.35.
Once we know the above, let’s take a look at the NYSE Arca Oil Index (XOI) chart.
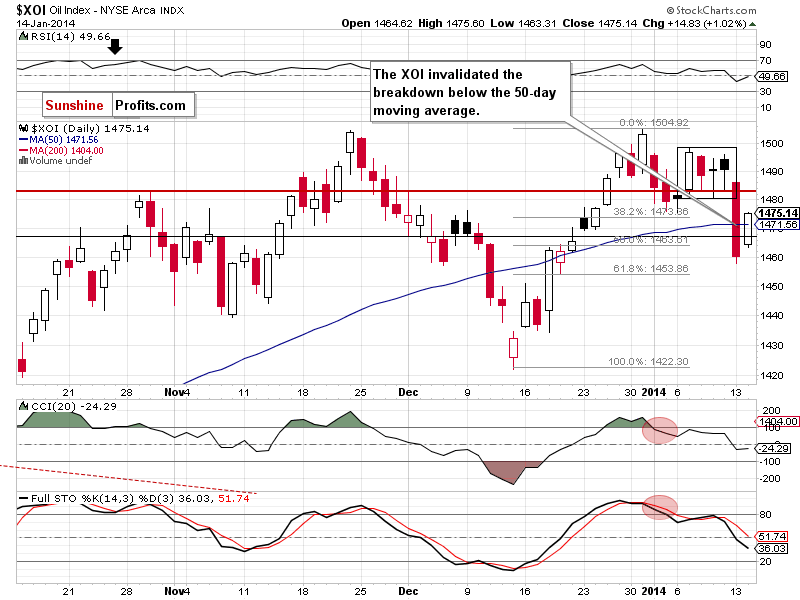
Looking at the above chart, we see that the situation has improved slightly as the oil stock index erased half of Monday’s drop. With this upswing, the XOI invalidated the breakdown below the 50-day moving average, which is a positive signal. Nevertheless, it still remains not only below the lower border of the consolidation range, but also previous January low. Additionally, sell signals generated by the CCI and Stochastic Oscillator remains in place supporting the bearish case. Taking these facts into account, further deterioration should not surprise us. If this is the case, the first support level will be Monday’s low and the one will be the 61.8% Fibonacci retracement level around 1,453. On the other hand, if the buyers do not give up and push the XOI above the previous January low and lower border of the consolidation range, we will likely see further improvement and a move to around 1,495-1,500.
Summing up, crude oil rebounded and closed the day just above the previously-broken short-term support/resistance line, which is a positive signal – especially when we factor in the position of the indicators and the situation in the CFD. Please note that although there have been two drops below the 50-week moving average, crude oil still remains above this important support. If these positive circumstances encourage oil bulls to act, we will likely see further improvement and an attempt to move above Friday’s high.
Very short-term outlook: bearish
Short-term outlook: bearish
MT outlook: mixed
LT outlook: mixed
Trading position (short-term): We do not suggest opening any positions at the moment. We will keep you informed should anything change, or should we see a confirmation/invalidation of the above.
Thank you.
Nadia Simmons
Forex & Oil Trading Strategist
Oil Investment Updates
Oil Trading Alerts

