
Trading position (short-term): In our opinion no positions are justified from the risk/reward perspective.
On Tuesday, crude oil climbed for the first time in three days and gained 1.13% as expectations of Cushing supply decline and worries about another cold spell, which can increase heating oil demand pushed the price higher. In this way, light crude rebounded and came back well above $97 per barrel.
Yesterday, crude oil gained as oil investors bet that the recent opening of the southern leg of TransCanada Corp.'s Keystone XL pipeline would begin to drain crude stockpiles at Cushing, Okla. Please note that inventories there have climbed to 41.8 million barrels - the highest level in more than six months. Therefore, although market participants are awaiting today’s report from the U.S. Energy Information Administration (which is expected to show crude supplies climbed by 2.2 million barrels last week), it seems that they are more focused on inventories at Cushing, Okla. at the moment.
Oil investors also expect that the EIA report will show that distillate supplies decline for the fourth straight week as colder-than-normal temperatures have boosted heating oil usage, pushing inventories down about 11% from a year earlier. As a reminder, the shrinking heating oil stockpile has helped push the price of light crude higher, because refiners will have to process more petroleum products to meet high demand even as they scale back their capacity to complete seasonal maintenance work.
Having discussed the above, let’s move on to the technical changes in the crude oil market (charts courtesy of http://stockcharts.com.)
In our last Oil Trading Alert, we wrote:
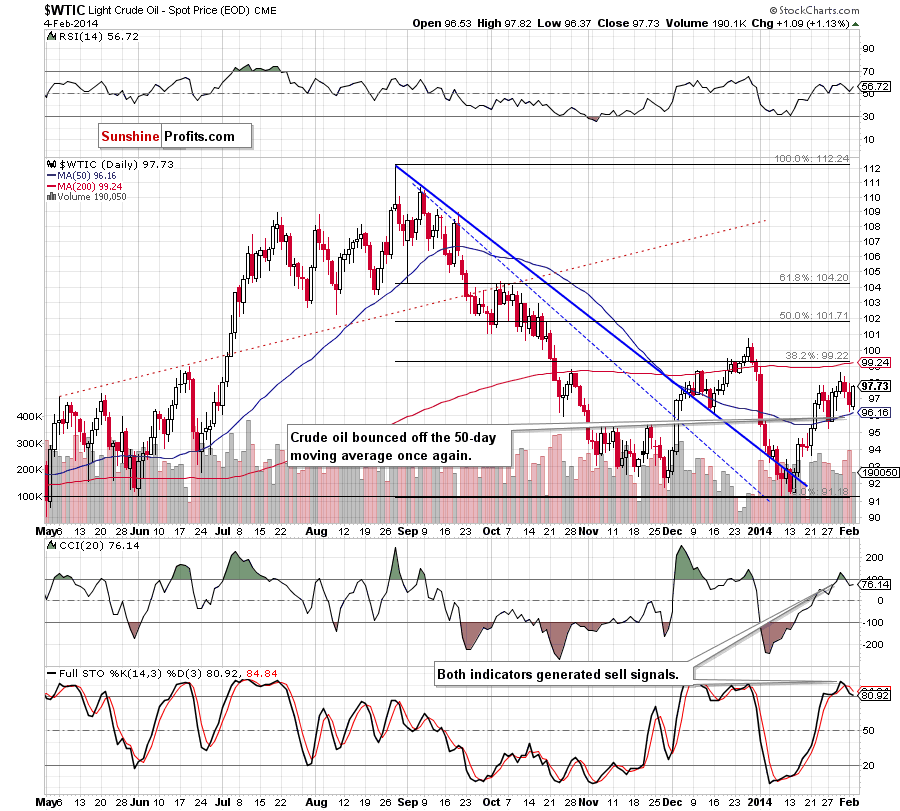
(…) crude oil (…) approached the 50-day moving once again. If this strong support encourages buyers to push the order button, we will likely see a corrective upswing in the coming days. However, if it is broken, we will see further deterioration and the next downside target will be the Jan.27 low at $95.21.
As you see on the above chart, crude oil bounced off the 50-day moving once again and came back above $97. Despite this increase, light crude remains below the 2014 high (and also below the previous high) and sell signals generated by the indicators are still in play. Additionally, yesterday’s upswing materialized on relatively small volume (especially compared to the previous day), which suggests that the strength of the buyers waned. All the above provide us with bearish implication, and from today’s point of view, a move to the downside is still likely to be seen. Nevertheless, if oil bulls manage to push the price above the January high, the first upside target will be the 200-day moving average, which corresponds to the 38.2% Fibonacci retracement level based on the entire Aug.-Jan. decline (around $99.20). Please note that this is a strong resistance zone, which will likely stop potential growth.
Having discussed the current situation in light crude, let’s take a look at WTI Crude Oil (the CFD).
Quoting our last Oil Trading Alert:
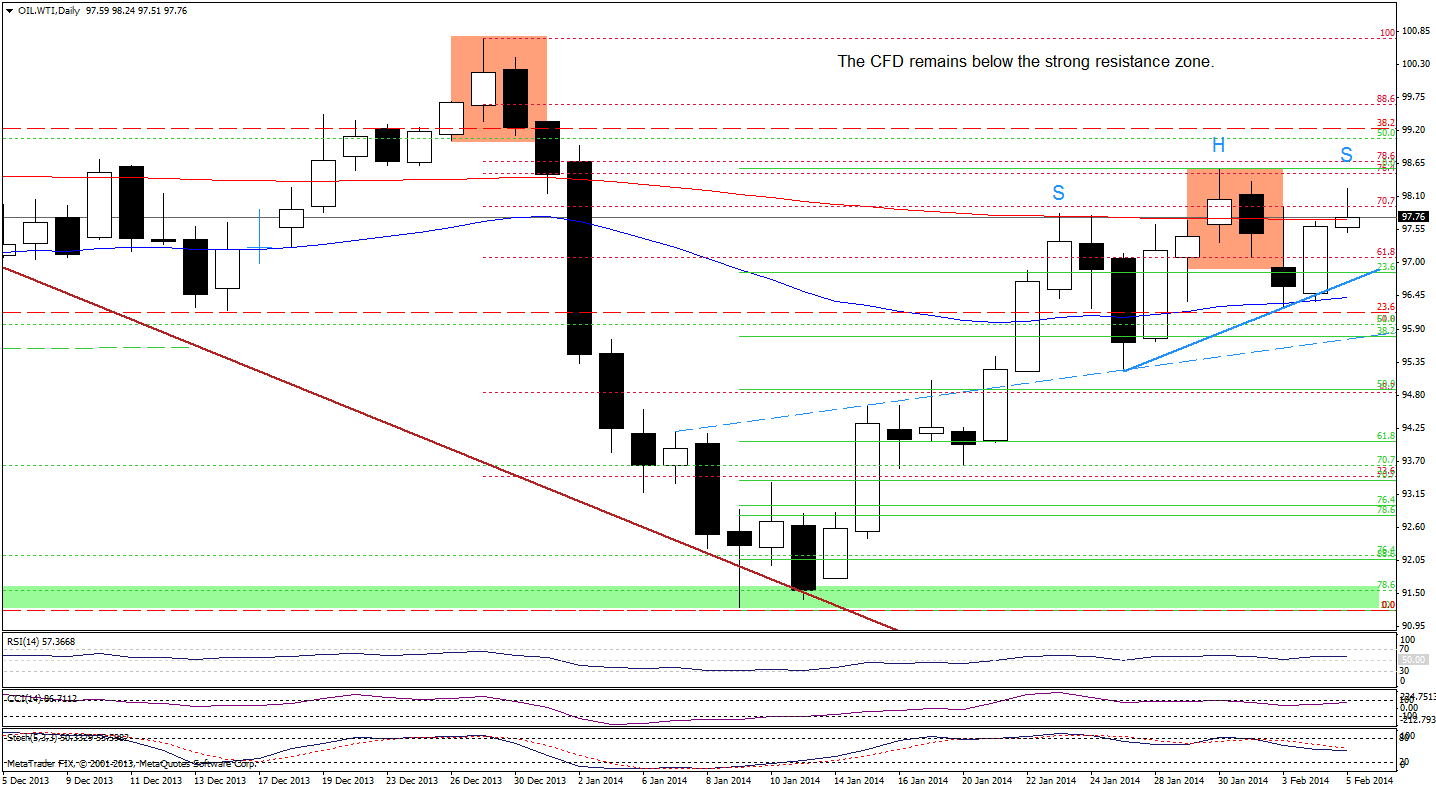
(…) WTI Crude Oil (…) reached the 50-day moving average. (…) this strong support encouraged oil bulls to act and triggered a small (…) corrective upswing earlier today. (…) as long as the CFD remains above the 50-day moving average, further declines are limited and we may see another attempt to move higher (even to the 200-day moving average).
Looking at the above chart, we see that the CFD extended gains and reached the 200-day moving average. Earlier today, we saw further improvement as WTI Crude Oil almost touched the Jan.31 high. Despite this growth, the CFD still remains below resistance level created by the January high and reinforced by the bearish engulfing pattern. Similarly to what we wrote yesterday, at this point we should consider two scenarios. If oil bulls do not give up and push the price higher we will likely see an increase to the 38.2% Fibonacci retracement level based on the entire Aug.-Jan. decline (just like in the case of crude oil). On the other hand, if the buyers fail and the CFD drops below the rising blue support line, we will likely see further deterioration. Additionally, if the 50-day moving average is broken, we will see a drop to (at least) the 38.2% Fibonacci retracement level based on the recent rally (which corresponds to the dashed blue support line at the moment).
Please note that if oil bears push the CFD below the rising blue support line and the 50-day moving average, we may see a head and shoulders formation. In this case, it’s quite possible that a potential correction will not stop at 38.2% Fibonacci retracement because the downside price target for this formation is slightly above $94 where the 61.8% Fibonacci retracement is.
Summing up, although the situation has improved at the first sight, crude oil still remains below important resistance levels. As mentioned earlier, if oil bulls do not give up, we will likely see a breakout above the January high. However, we should keep in mind that the strong resistance zone created by the 200-day moving average and the 38.2% Fibonacci retracement will likely stop this potential upswing. However, looking at the situation in the CFD, we may see a bearish top formation. If it is confirmed, we will likely see another pullback in crude oil. Please note that the position of the indicators (in both cases) favor the sellers at the moment.
Very short-term outlook: mixed
Short-term outlook: bullish
MT outlook: bullish
LT outlook: mixed
Trading position (short-term): In our opinion, there were no significant changes in crude oil that justify opening short or long positions at the moment. We will keep you informed should anything change, or should we see a confirmation/invalidation of the above.
Thank you.
Nadia Simmons
Forex & Oil Trading Strategist
Forex Trading Alerts
Oil Investment Updates
Oil Trading Alerts

